
From core to complexity: What investor hurdle rates tell us about 2026
The Active Capital Survey 2026 series.
20 January 2026

Required returns scale with risk
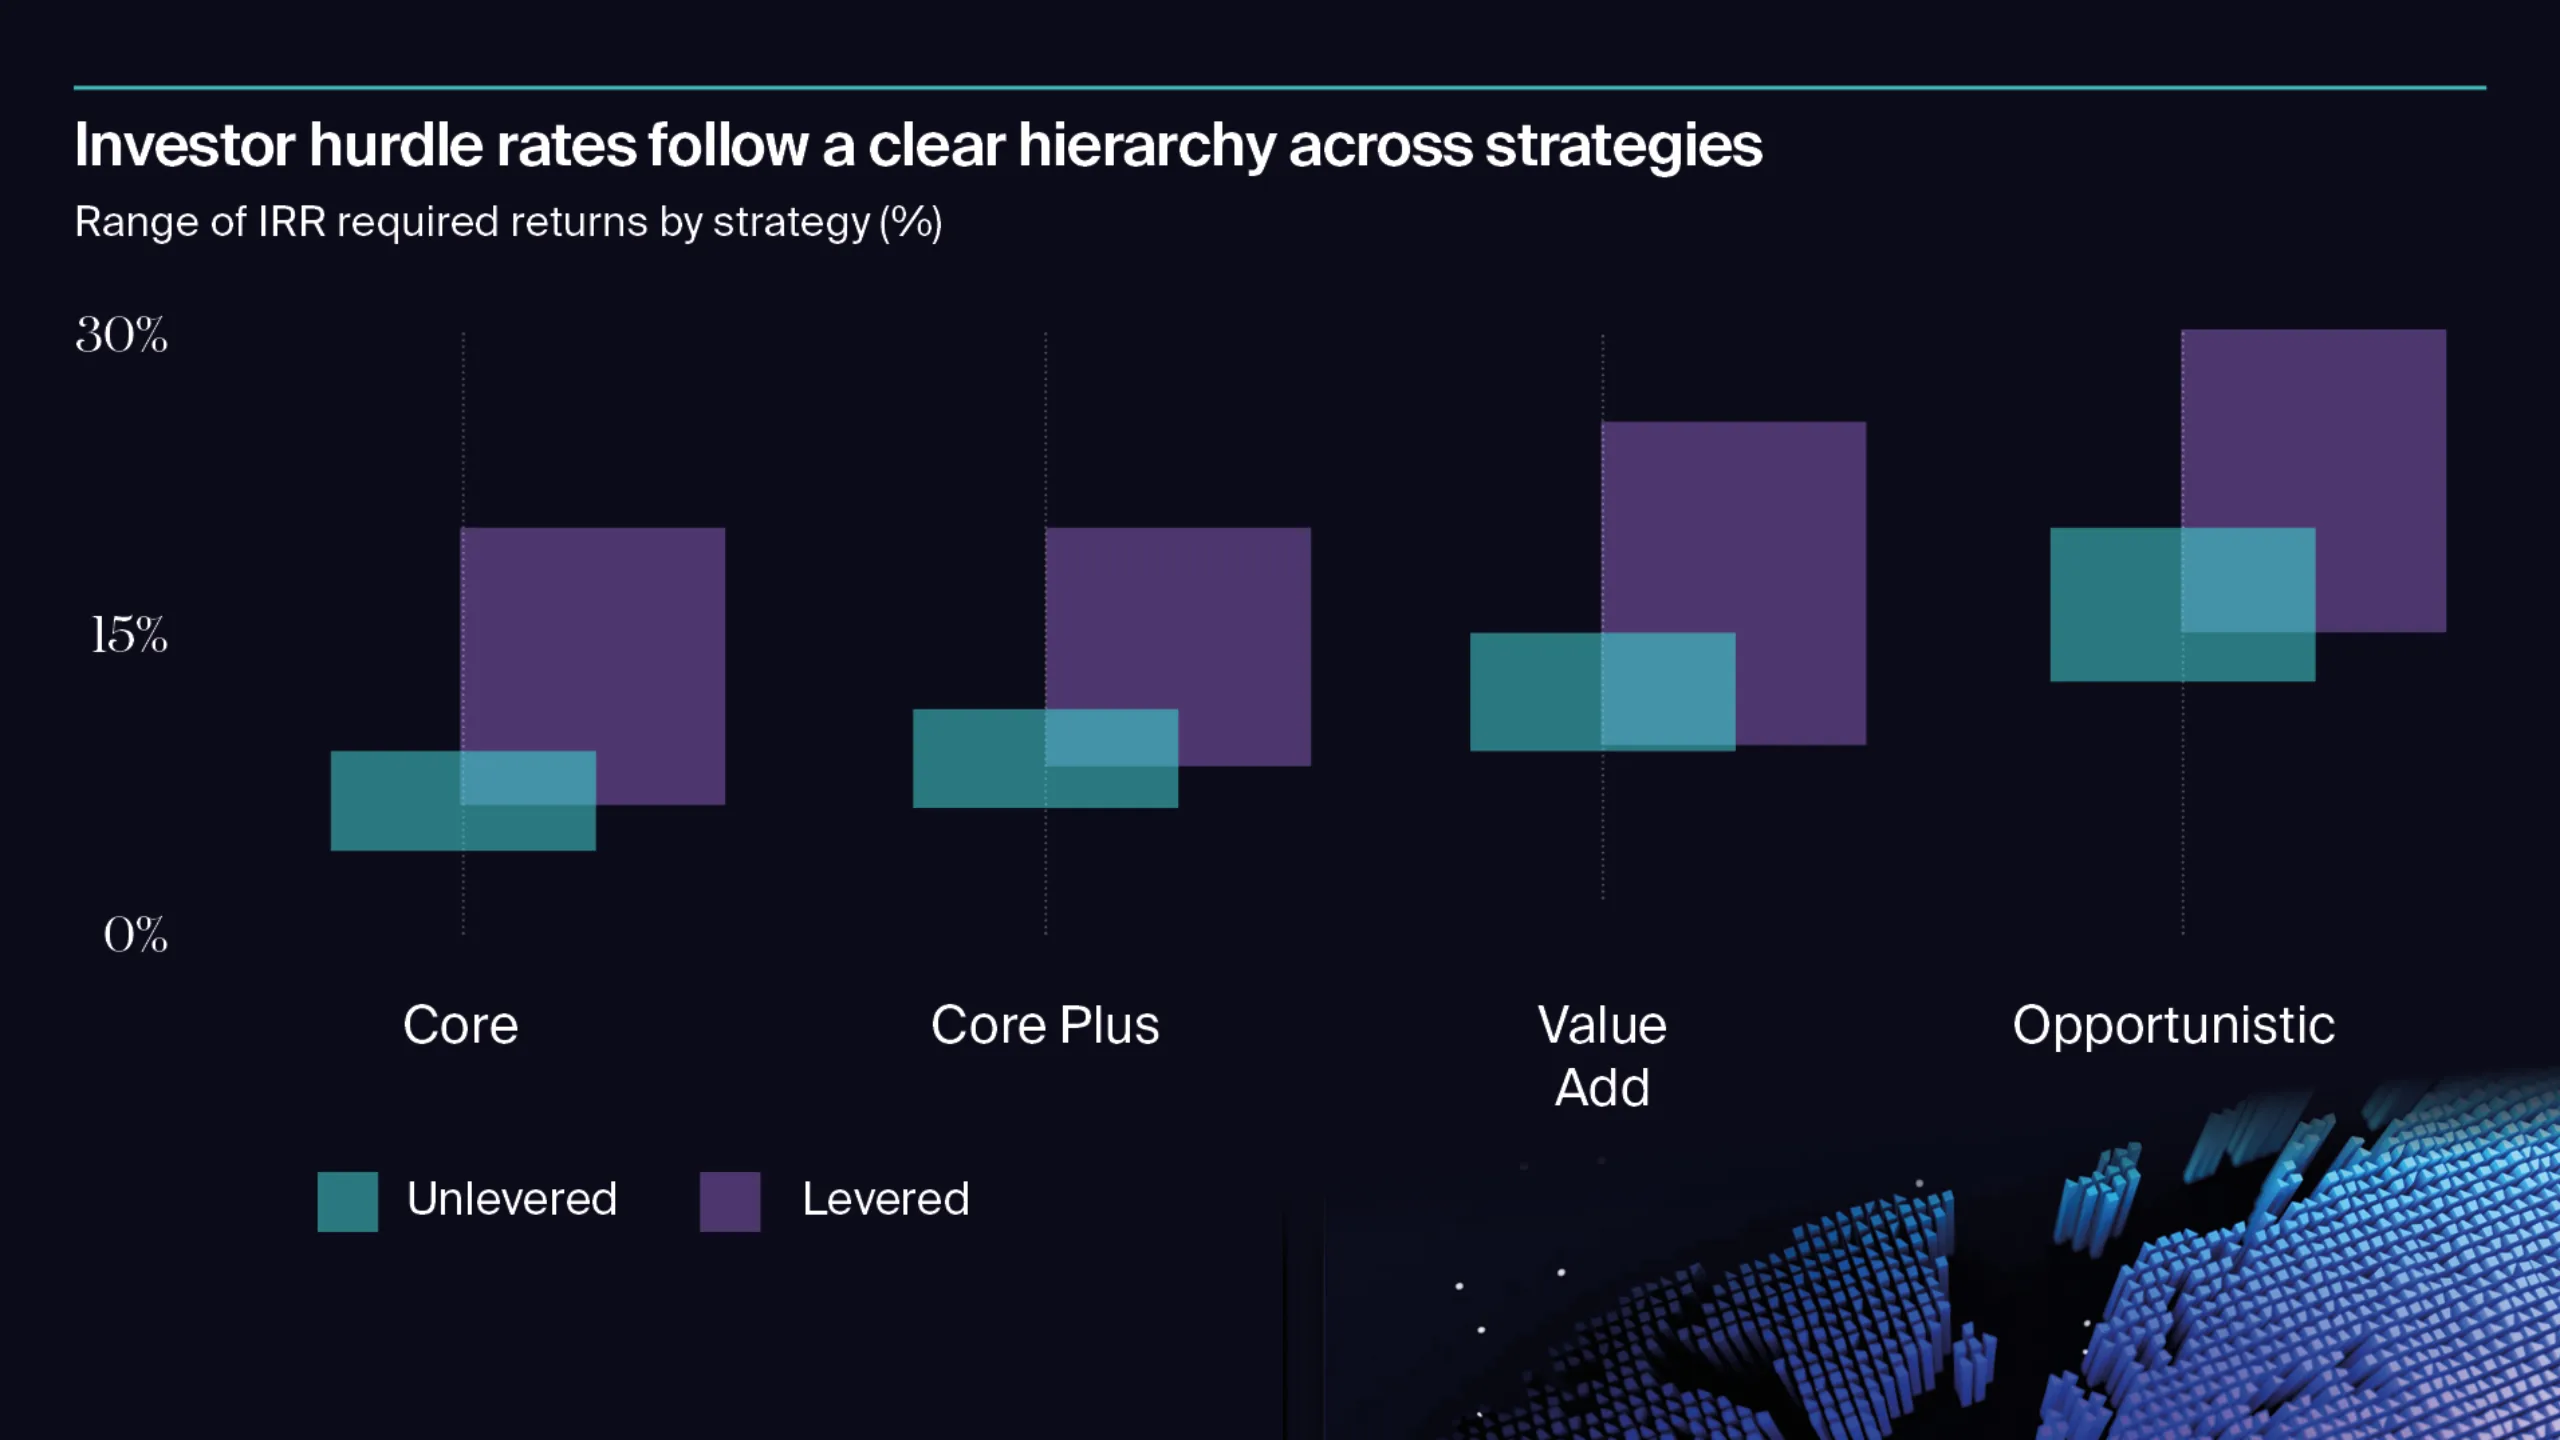
The average gap across strategies, up to more than ten percentage points on a levered basis, reflects liquidity, complexity, execution risk and market volatility. This reinforces the need for disciplined underwriting and selective positioning.
For the analysis below, we focus on levered IRR return requirements, as this was the most reported metric. However, investors use a variety of measures, including unlevered IRR, Equity Multiple and Cash-on-Cash.
For some Core investors, including sovereign wealth funds, timing of cash flows is less relevant, making cash-on-cash a preferred metric. This explains why there is less levered IRR required return data at the Core end of the tables that follow.
Levered Return Analysis
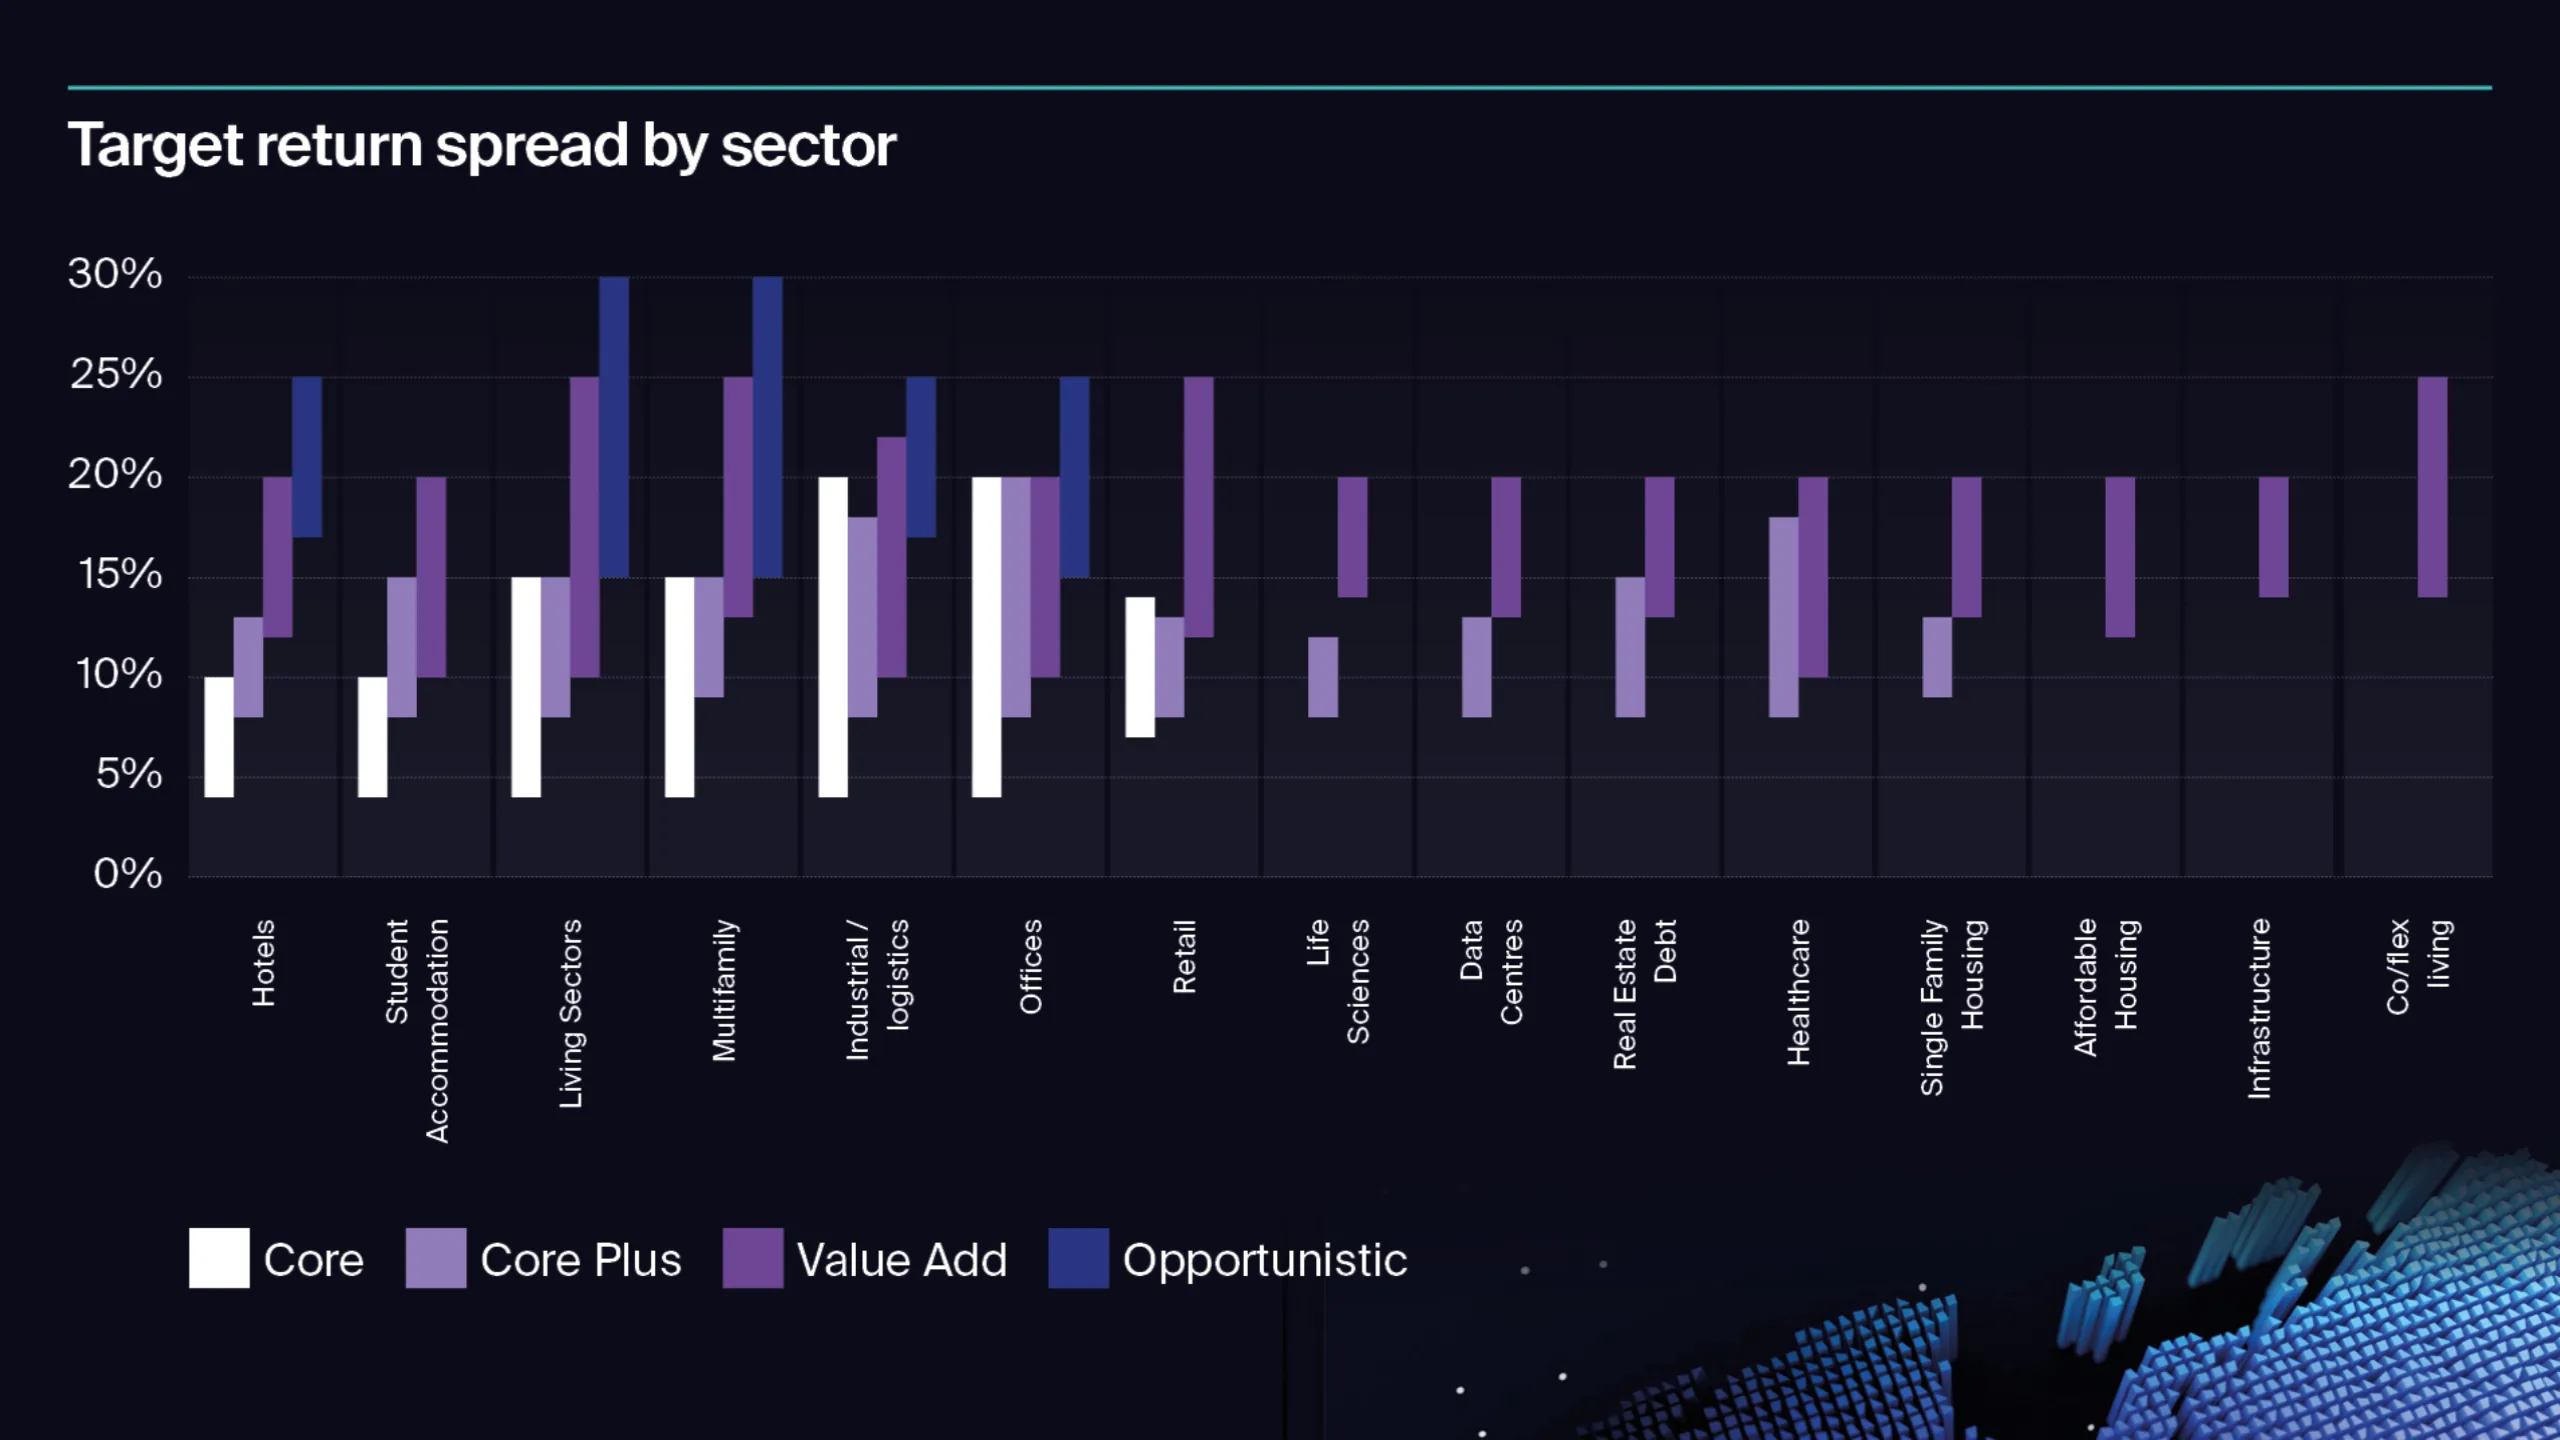
1. Returns are broadly consistent across key sectors: Offices, logistics and residential show tight clustering of average levered IRR required returns for Core Plus (≈11%) and Value Add (≈16%), while the ranges for these sectors span 8%-20% for Core Plus and 10%-25% for Value Add. This consistency of average returns for each strategy suggests investors price risk similarly for liquid, transparent sectors.
2. Core shows wider variation: Core average levered IRR hurdle rates range from 7.5% in living sectors to over 9% in offices/logistics, the ranges for these sectors are 4% - 15% and 4% - 30%, respectively. This reflects sensitivity to country risk premiums and liquidity differences. This indicates it is important to stress / scenario core assumptions against interest rate movements and liquidity outlooks.
3. Living sectors stand out: Student accommodation and multifamily have lower average Core IRR hurdles (7.5–8.7%) (ranging between 4%-10% and 4%-13%, respectively), signalling perceived income resilience and demographic-driven demand. Value Add average IRR hurdles rise above other sectors however, potentially reflecting operational complexity and nascent product in some markets at this level of risk.
4. Operational sectors demand higher returns at riskier strategies: Investors targeting Data centres, healthcare, life sciences and infrastructure have average levered required returns in excess of 16% for Value Add (Value add across these sectors range from 13/14% - 20%, apart from healthcare which ranges from 10% - 20%). However, Core Plus hurdles appear relatively competitive by contrast (≈averaging 10–11% and ranging between 8% - 13% for Data Centres, 8% - 18% for healthcare, 8% - 12% for Life Sciences and 8% - 15% for Infrastructure), indicating risk escalates more sharply than some other types of sectors. Investors indicate that JV and capital partnering structures which tap into specific expertise, are likely to be key across these sectors.
Caveat
These figures are not returns for each sector alone. They represent the average levered IRR required return for investors who include these sectors within multi-sector allocations. This may ‘hide’ or distort some of the relative differences in sector targets. Sector-specific pricing will vary by asset quality, geography and execution complexity.
Capital sources and return requirements
Location of investor appears to have greater impact on required return than investor- type, while acknowledging that leveraged IRR required return comparables are more limited as investors use a range of return target types across strategies not captured here.
Investor HQ location
UK- headquartered investors report materially higher average leveraged hurdle rates for core plus (c..5%) compared with other European peers at c. average10.7%, although the ranges are similar, with UK core plus HQ responses ranging from (10% - 18%) and Europe excl. UK responses ranging from (9% - 18%).
This also likely explains why interest rates are listed by 51% of investors as being a top three thematic driving commercial real estate investment. Hedging costs are also likely to be a focus of cross-border investors too. As the results are based on a global survey, the higher end of core target returns also reflect investor target returns in smaller non-global locations with higher levels of country risk and reduced liquidity.
Levered return analysis by destination
Similar to the sector-level analysis, average levered Core IRR required return requirements by destination vary more widely (c.119 bps) than Core Plus or Value Add.
This dispersion at the Core end likely reflects the influence of the risk-free rate, which varies across locations and forms a more significant share of the required return than the risk premium alone. Country risk premiums embedded within the risk-free rate, alongside the explicit risk premium, may amplify these differences.
1. Core: Destinations including Asia have the highest average Core levered IRR required return at 9.64% (ranging from 4% - 20%), compared with 8.45% for Australasia (range 4% - 10%). Because of the range of targets for core and higher proportion of unlevered targets, we have not presented comparable analysis for Europe excluding the UK or North America. The implication again is that core pricing is sensitive to local interest rate environments and sovereign risk. Investors targeting Core in higher-rate jurisdictions will need to stress-test assumptions against rate volatility and liquidity outlook.
2. Core Plus: The differential between average IRR Core Plus required return tightens to 89 bps, with destinations including Europe excluding the UK showing the lowest average levered IRR hurdle rate (range 9% - 18%).
3. Value Add: The average spread across destinations is also 90bps, with destinations including APAC (Asia and Australasia) posting the two lowest average levered hurdle rates. This suggests Value Add offers a relatively globally consistent risk-return profile, at least at the more regional level. APAC markets may provide relative value for investors seeking upside without full risk. This reflects confidence in demand fundamentals and liquidity in these regions.
Caveat
These figures are not returns for the destination alone. They represent the average levered required return for investors who include these regions within multi-destination allocations. This may ‘hide’ or distort some of the relative differences in geographic targets.
Core variation stands out against consistency beyond?
Investor hurdle rates tell a story of consistency and divergence. Across sectors and destinations, average Core Plus and Value Add strategies cluster relatively tightly, even if the ranges vary, indicating there may be commonalities in risk premia calculations that transcend borders and sectors, albeit it may be because the returns are not specifically for individual sectors and destinations. By contrast, average Core hurdles vary more widely, likely reflecting sensitivity to local interest rate environments and embedded country risk premiums in the risk-free rate, which itself will typically be a larger proportion of the required return in relative terms than for higher risk strategies.
For Value Add, the relative uniformity of average hurdle rates globally signals opportunity. APAC markets, with the lowest average Value Add hurdles, offer relative value for investors seeking upside. Conversely, UK and North America carry a slight premium, although they come with the benefit of liquidity and being top global destinations, the UK at number one for cross-border capital flows.
Sign up to receive regular Active Capital insights.
Read more
Explore the rest of our Active Capital insights.

Active Capital
Welcome to the Knight Frank Active Capital Survey 2026
Investor sentiment is shifting from caution to conviction following higher interest rates, pricing uncertainty and constrained liquidity.
20 January 2026

Active Capital
The Knight Frank Active Capital Survey 2026: How investors plan to deploy $144bn
The survey reveals how capital flows, sector priorities and strategic positioning will shape 2026.
20 January 2026

Active Capital
Capital on the move: How optimistic investors are targeting direct commercial real estate in 2026
How optimistic investors are targeting direct commercial real estate in 2026.
20 January 2026

Active Capital
Sector strategy for 2026: Offices to anchor allocations as demographics and technology drive diversification
Offices will be the top targeted sector in 2026. Investors will likely focus on prime assets in core CBDs where there is income resilience.
20 January 2026

Active Capital
Capital strategies: Defensive anchors, opportunistic plays and the rise of partnerships
The Active Capital Survey 2026 indicates an investor base delicately balanced between caution and conviction.
20 January 2026

Active Capital
Core capital returns: The outlook for core liquidity, recovery and strategy in 2026
Core investment is set to regain momentum, driven by stabilising debt, narrowing bid–ask spreads and improving return profiles.
20 January 2026

Active Capital
From core to complexity: What investor hurdle rates tell us about 2026
Investor hurdle rates follow a hierarchy across strategies. The gap shows liquidity, complexity, execution risk and market volatility.
20 January 2026

Active Capital
Investor opportunities: Prime offices, repricing plays and structural growth sectors
Respondents to the survey identify three dominant opportunity clusters shaping investor strategy for the year ahead.
20 January 2026

Active Capital
Top themes: Seven forces shaping capital decisions in 2026
The Active Capital Survey 2026 identifies seven tightly clustered forces that will define investment decisions in the year ahead.
20 January 2026