
Core capital returns: The outlook for core liquidity, recovery and strategy in 2026
The Active Capital Survey 2026 series.
20 January 2026
At a glance
After a prolonged period of retrenchment, Core investment is set to regain momentum in 2026, driven by stabilising debt costs, narrowing bid–ask spreads and improving return profiles. Liquidity will return selectively, anchored in markets with transparency and pricing clarity.
- 63% of respondents intend to include Core within their investment strategies
- This equates to $37bn of deployable capital among survey participants
- 74% of Core investors expect to be net buyers in 2026, signalling heightened competition for prime assets
- Average planned allocation to Core among those targeting it is 51% – the highest of any strategy
Planned capital deployment for 2026 is split across the different risk strategies. 26% planned of investment is set to target Core ($37 billion), 23% Core Plus ($33 billion), 19% Value Add ($27billion) and 28% Opportunistic ($40 billion) (does not total 100% as not all investors specified strategy percentages).
- Offices, logistics and living sectors anchor allocations
- Emerging plays include single-family rental and infrastructure, albeit at modest weights
- UK and Germany lead core destination rankings, followed by France, Spain and the Netherlands
- Japan and Australia emerge as diversification plays
- Investment managers dominate by number and AUM; institutions add weight, prioritising stability and liability matching
- North American capital expected to shape liquidity in Europe and Asia-Pacific
- Early positioning in prime assets likely key as competition set to intensify
- Partnerships and collaborative structures likely to accelerate access to scale and complexity
Core by numbers: What the Active Capital Survey data reveals
The overall survey captured the intentions of 119 global investors, collectively representing more than $1.4 trillion of AUM and dry powder of $144 billion to deploy in 2026.
Within this:
- 63% of respondents stated they intend to target Core as a strategy in 2026
- An estimated $37bn of investment capital within the survey pointed towards targeting core strategies in 2026
- For investors targeting Core, the average planned proportion of investment spend is 51%, the highest of any strategy
- 74% of investors targeting core are set to be net buyers in 2026
This reflects strong conviction in Core strategies but also points to a structural challenge if demand outstrips available stock for sale. While the imbalance may be less severe than headline figures suggest, as many sellers may not be targeting core, so not captured in this statistic, the result is likely heightened competition for prime assets, particularly in gateway markets. For investors, this underscores the need for early positioning and, in some cases, partnership structures to secure scale.
A look back on activity
Core capital has seen a significant reduction in activity over recent years, a pattern largely shared across the risk spectrum.
Rising interest rates and bond yields, pauses in activity amid uncertainty, limiting comparables and increasing opacity, as well as persistent bid–ask spreads have all contributed to constrained deployment. This led to retrenchment for both Core and non-Core investors alike. The difference lies in the pace of recovery. Non-Core investors, while still not back at pre-pandemic levels, have been re-engaging more quickly.
These investor types include private equity, which traditionally focuses on value-add and opportunistic strategies albeit, in recent years, broadened its remit to include Core Plus and selectively, Core strategies. Private equity’s ability to be nimble, capture early-cycle opportunities and create product in newer sectors typically sets the stage for more defensive, institutional capital to follow – also acting as a leading indicator of cycle turns.
Core investors, such as sovereign wealth funds, pension funds and insurers, typically operate under mandates prioritising income stability and capital preservation. Their decision-making processes involve multiple layers of investment committees and pre-agreed strategies, requiring clear evidence of recovery and pricing stability before action. This structural caution explains why Core volumes reached a trough towards the end of 2024 and have been slower to rebound, even as opportunistic and value-add capital turned the corner in late 2023.
Why core capital is set for conviction
The reasons are both performance-led and structural:
Sustained positive total returns and early signs of return of capital value growth.
Recent trends in global core property funds point to a sustained recovery in total returns, with early signs of improvement in capital growth, a critical component for core investors. Based on the MSCI Global Quarterly Property Fund Index (Unfrozen), most regional and sector clusters have delivered positive annualised total returns for two consecutive quarters (albeit with Asia Pacific and North America ‘Other’ as exceptions).
At a global level, retail led the turnaround in total return from mid-2024, followed by logistics and hotels later that year, residential towards year-end, and offices returning to positive territory by summer 2025. This core story has been largely income return, with capital growth dragging total returns temporarily into negative territory. Indeed annual income returns in the MSCI Global Quarterly Property Fund Index (Unfrozen) at the sector level have remained consistently positive since the inception of the index in 2008.
The capital growth picture is more nuanced but also increasingly encouraging. Logistics, retail and residential sectors moved back into positive growth during 2024, while offices remain marginally negative at the time of writing. The nuance is that office capital growth has improved significantly from deep negative territory in early 2024 to near-neutral levels by Q3 2025. This trajectory suggests that the missing piece for core investors, capital appreciation, is beginning to re-emerge, reinforcing confidence for investment activity by core investors in 2026.
Interest rate stabilisation and further moderation of bond yields expected – in some markets
Policy Rates: Key forecasters, including Oxford Economics and Capital Economics, expect central banks to continue easing policy rates through 2026, albeit selectively and at a slower pace than in 2025. The Eurozone has largely stabilised, albeit Japan and potentially Singapore remain exceptions to the easing trend, with Japan forecast to see a modest increase in its policy rate of around 50bps. Elsewhere, the UK and US are expected to see incremental cuts, but not a return to pre-pandemic lows.
Risk-Free Rates (Bond Yields): On the risk-free side, Oxford Economics projects that government bond yields will remain broadly stable, with only marginal movements. Japan may see the largest upward adjustment (circa +50bps), while the UK, US and Australia are forecast to experience slight downward drifts of between 6–17bps over the next year. This reflects a stabilising macro environment where inflation is easing but not fully back to target, limiting aggressive yield compression.
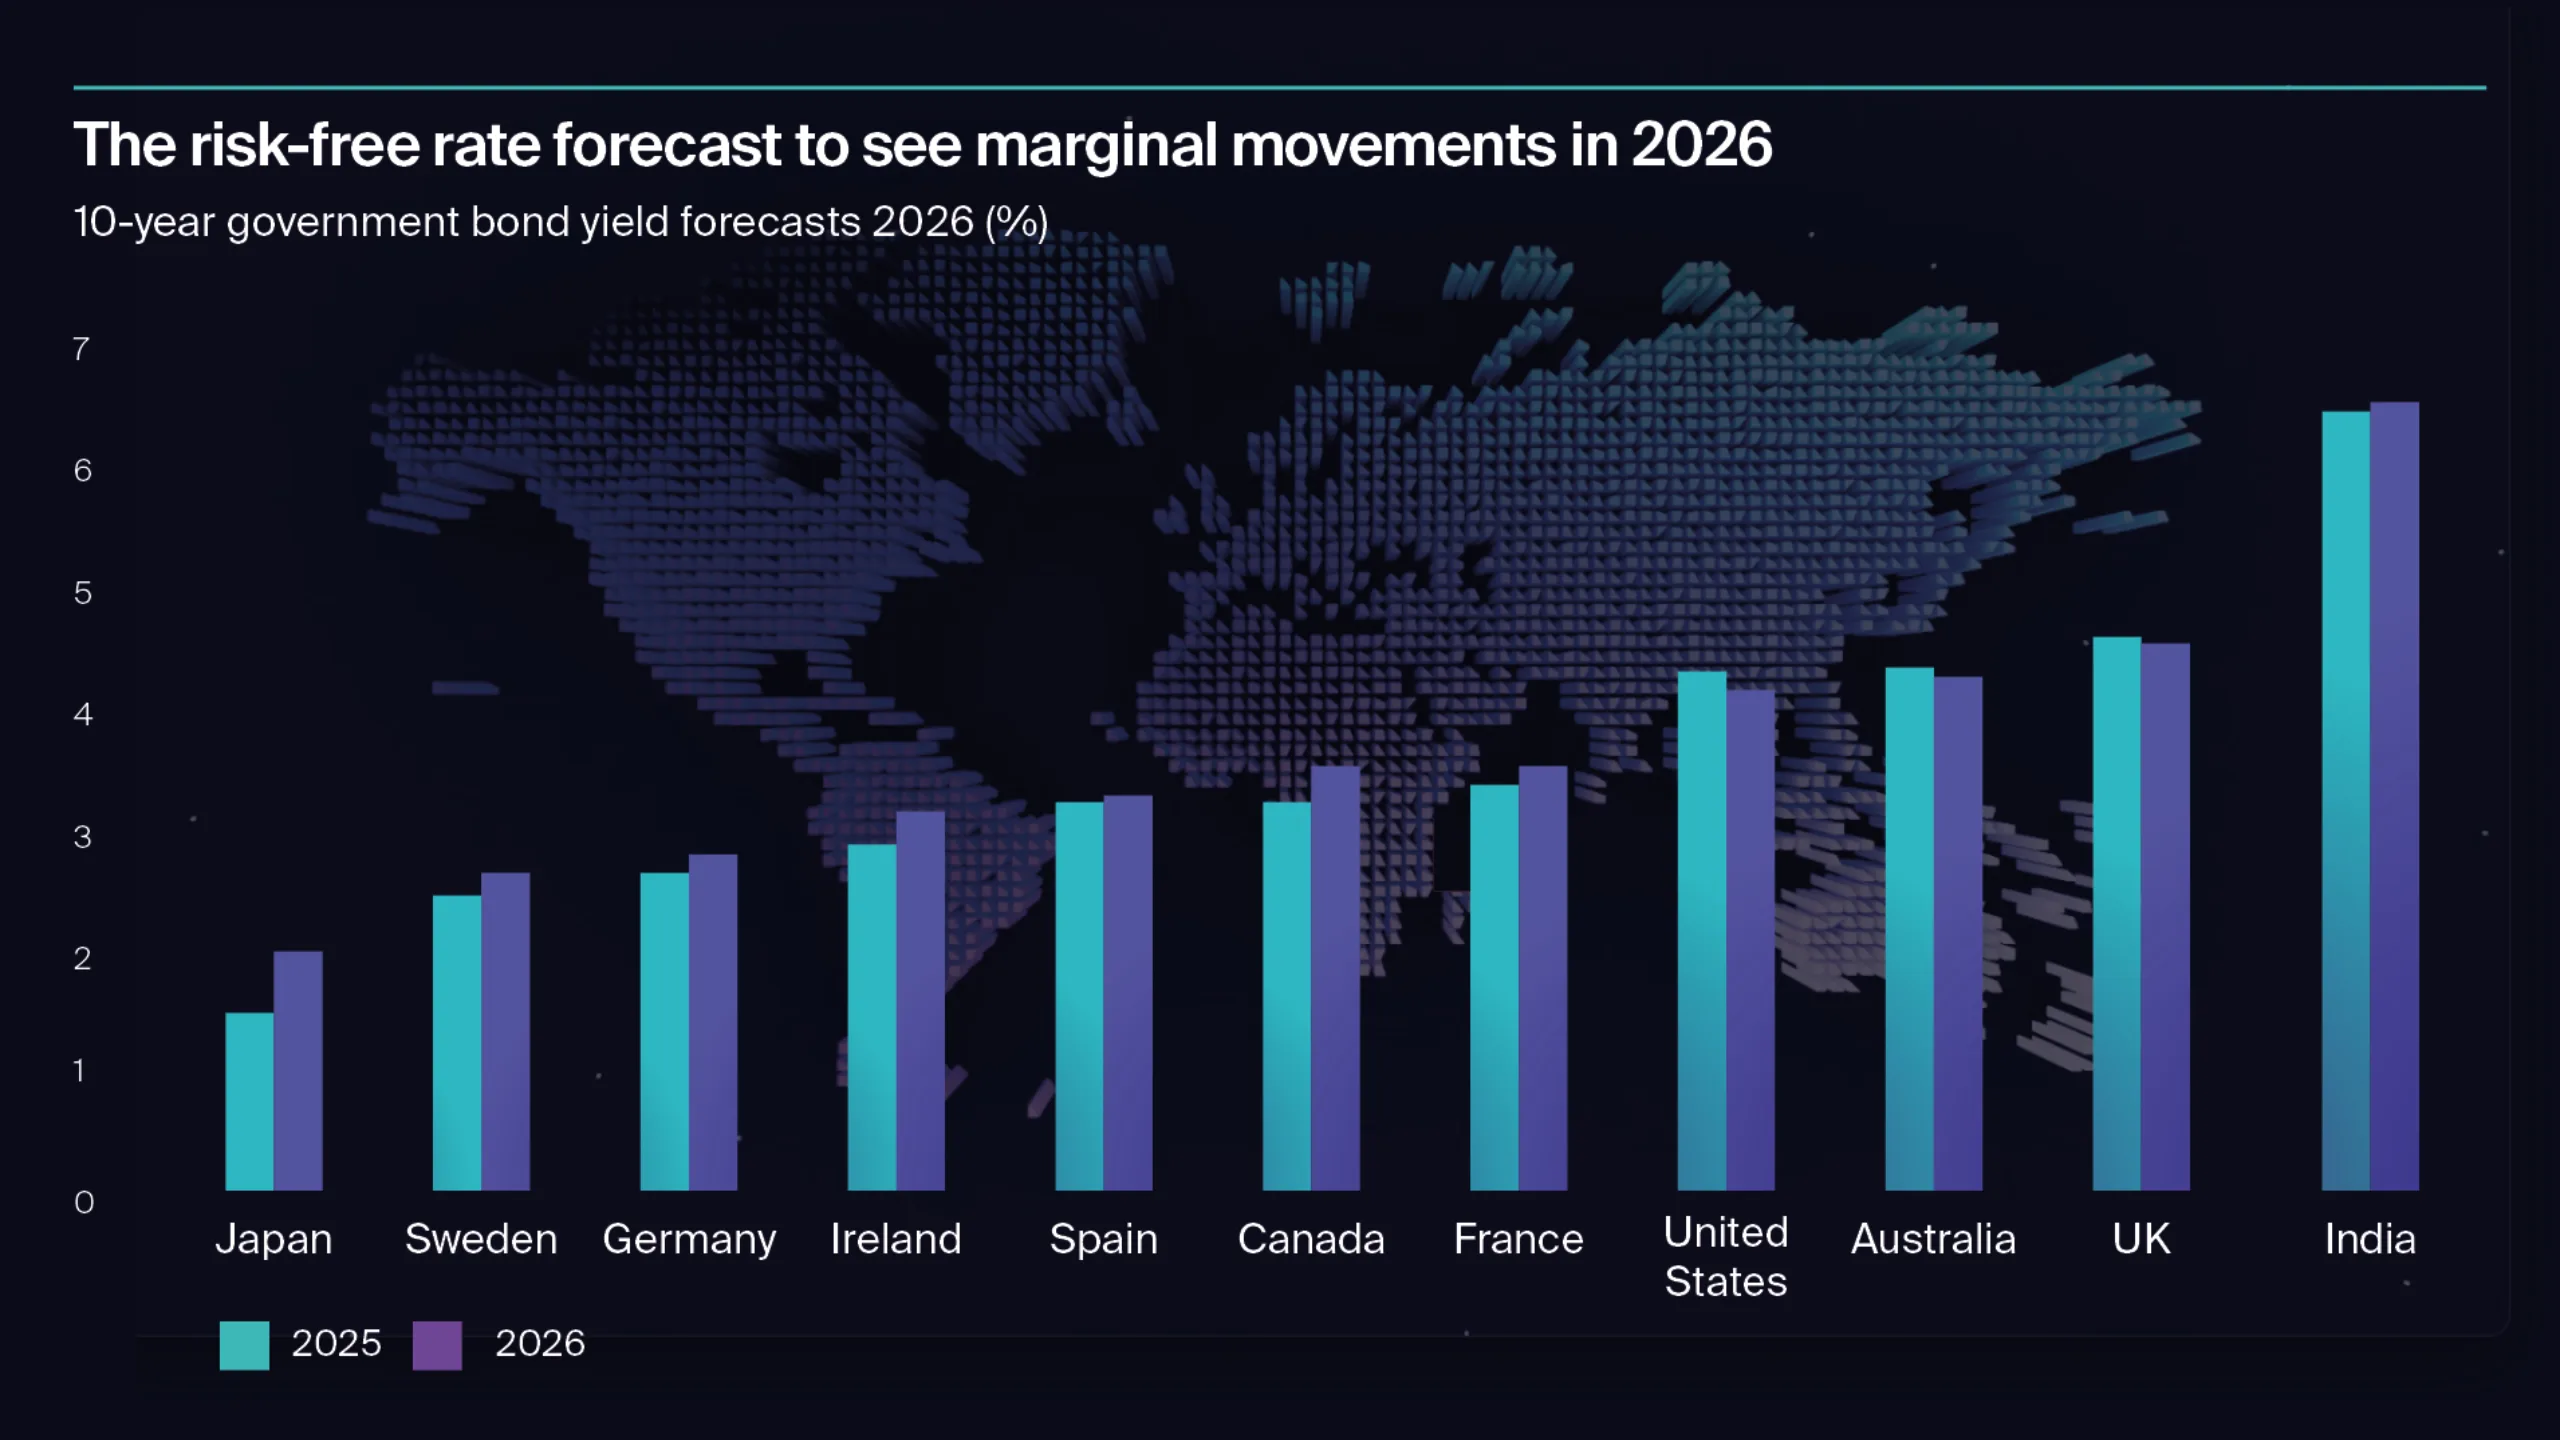
Source: Oxford Economics, Knight Frank
Mercer’s ‘Top considerations for Insurers 2025’ reinforces this outlook, noting that US 10-year Treasury yields reduced to around 4.0% by late 2025 (down 50bps since the start of the year) and that “a steady decline in base rates is the most likely scenario” into 2026. While bond yields remain elevated compared to pre-2022 norms, they suggest that the trend is towards moderation rather than further sharp increases. This compresses the relative advantage of fixed income and strengthens the case for Core real estate as a defensive allocation with long-duration income streams. Indeed stabilising bond yields help narrow bid–ask spreads, support restoration of confidence in valuations and likely help unlock investment committee approvals in governance-heavy institutions. It is also worth remembering that the risk-free rate to be considered is the average over the term of investment rather than the rate at the point of time of evaluation.
Portfolio rebalancing by institutional investors
Some institutional capital such as pension funds and insurers, may have needed to dispose of liquid, more quickly saleable, prime assets over the last few years to rebalance portfolios against strategy constraints and liquidity needs. This means that some may hold a higher proportion of secondary or Core Plus assets which do not meet their long-term risk and liability matching requirements. This is likely to support rotation out of secondary/Core Plus and back into Core over 2026 as governance frameworks prioritise stability and income. Indeed, Mercer’s ‘Themes and opportunities 2026’ and ‘Top considerations for insurers 2025’ both emphasise governance-led prioritisation of stability and liability matching as volatility subsides. Insurers are advised to “stay close to strategic asset allocations, maintain liquidity discipline, and deploy longer-term assets effectively.”
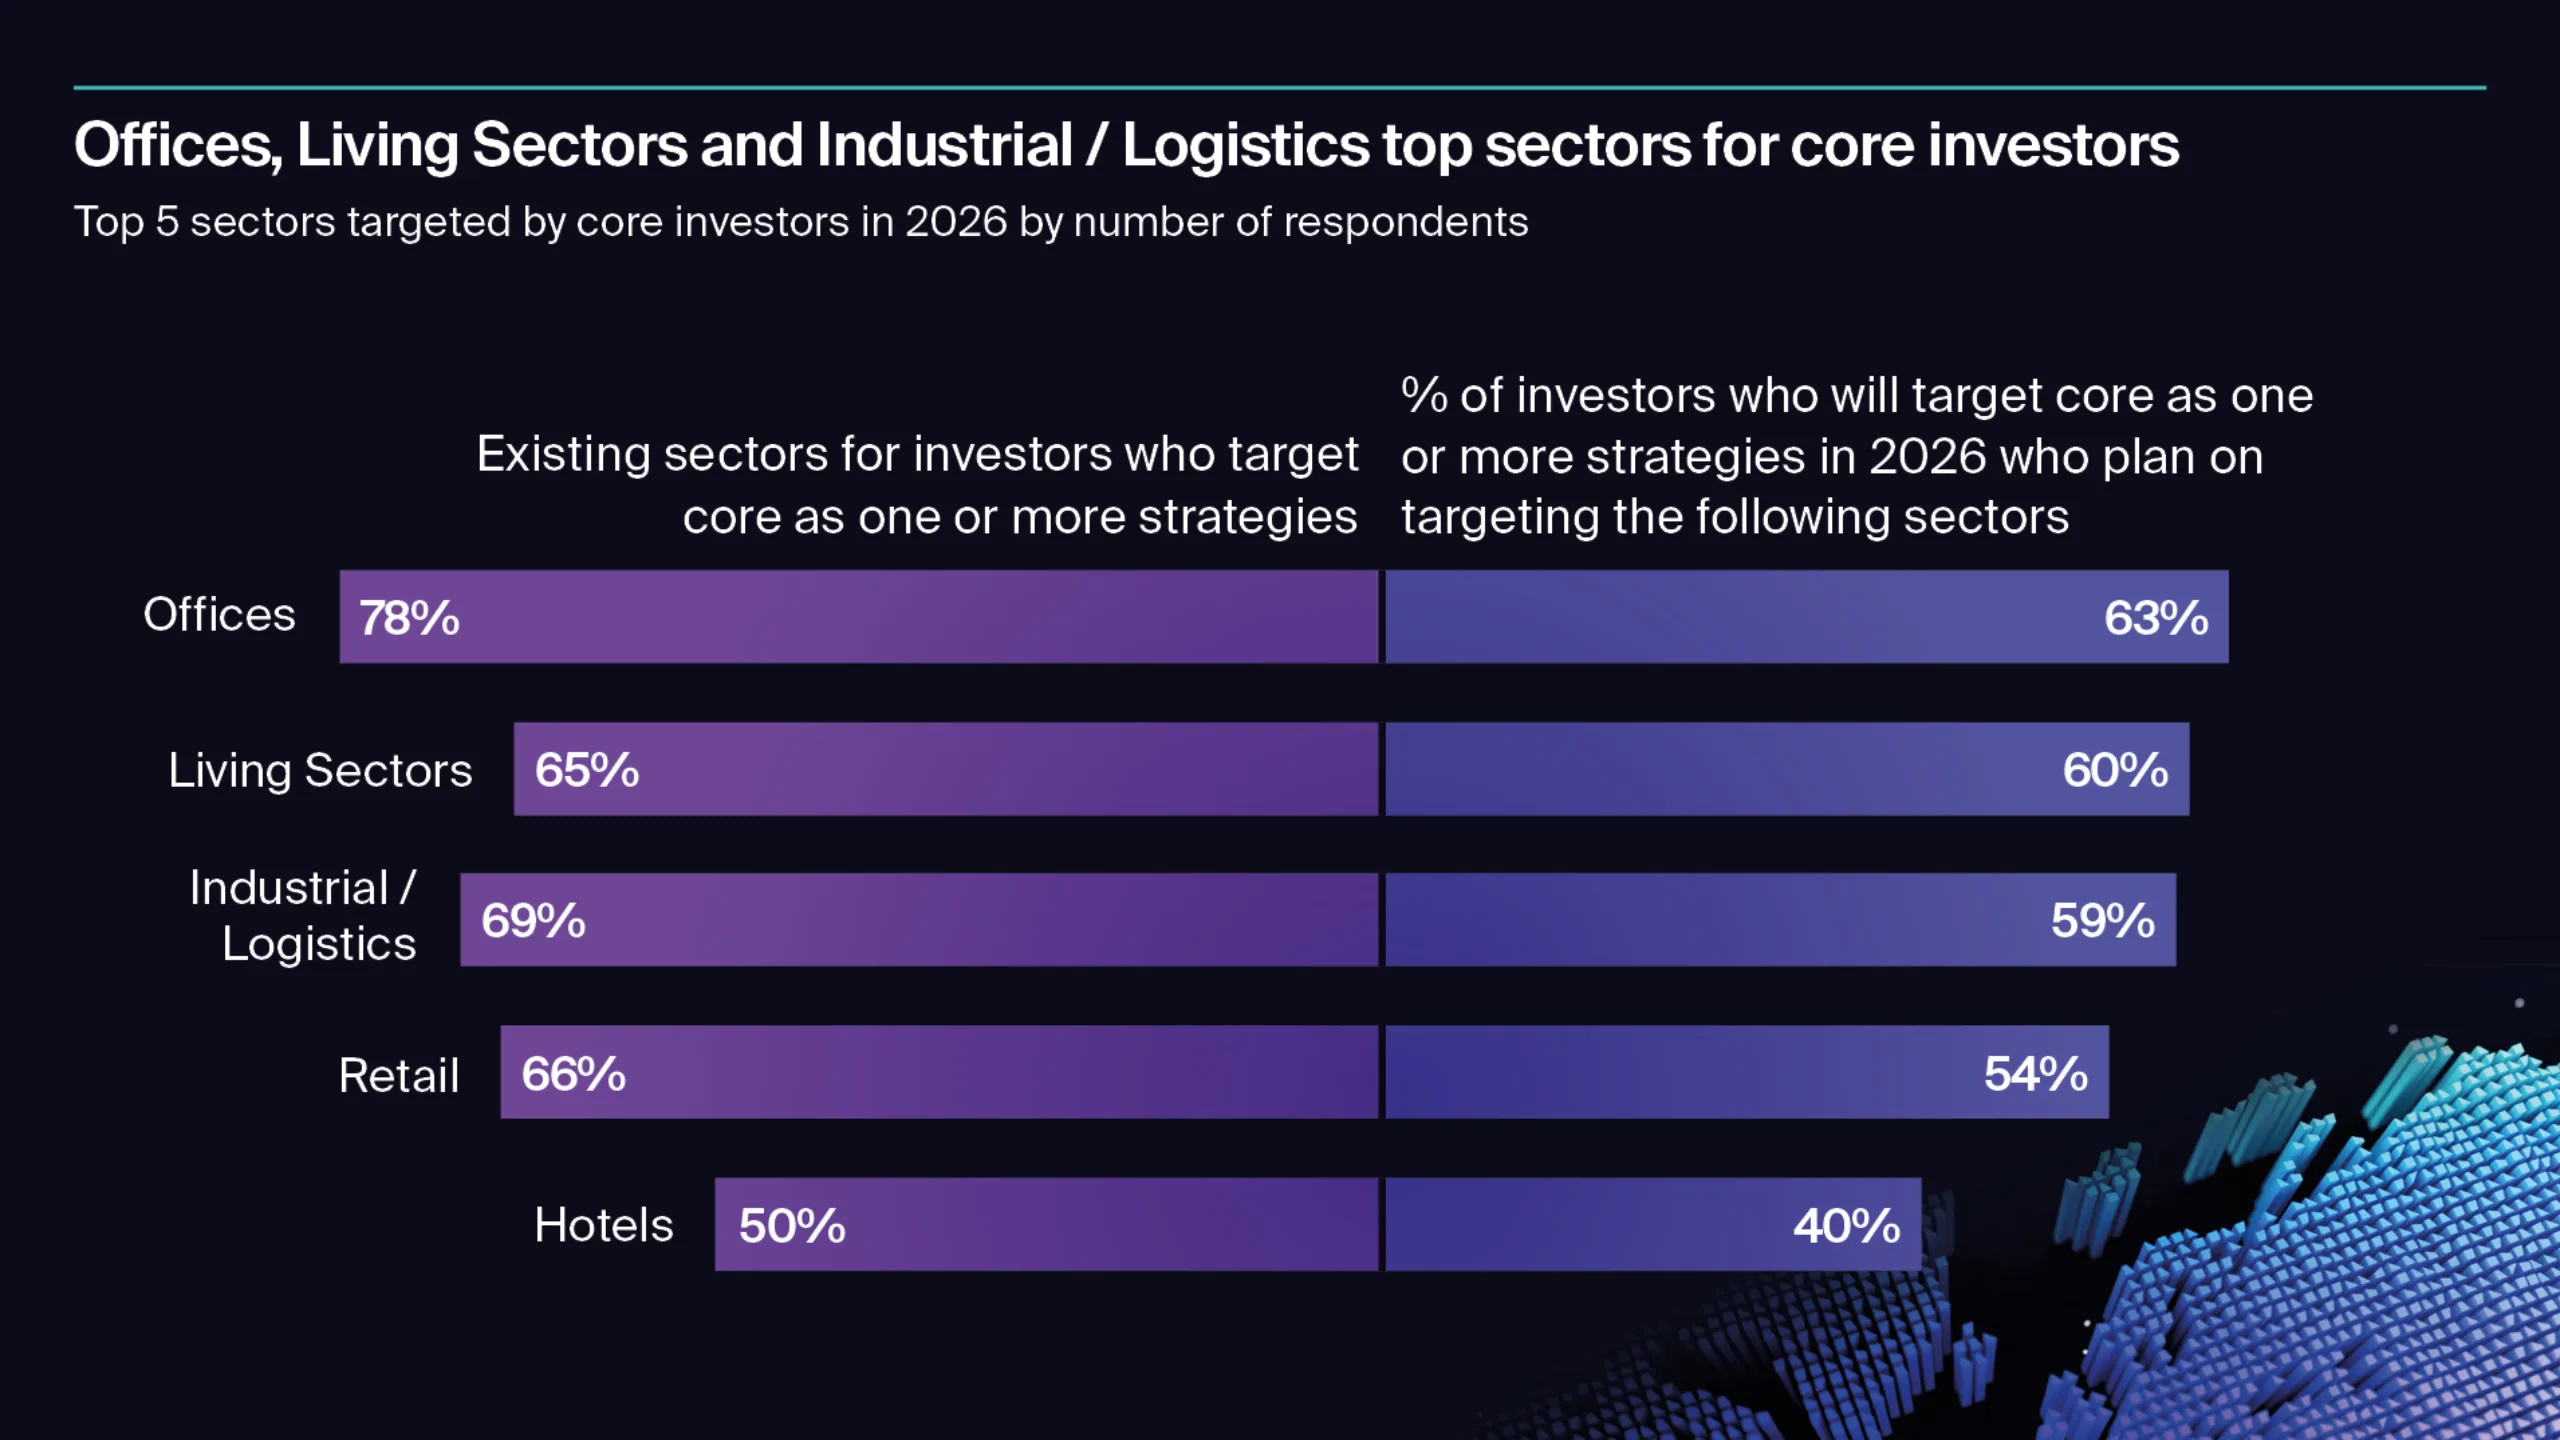
Sector focus for Core investors remains anchored in traditional segments:
- Offices: 63% of Core investors plan to target this sector (versus 69% overall)
- Living sectors : 60% (versus 65% overall)
- Industrial/logistics: 59%
- Retail: 54%
Five questions that define the future of core capital
To understand the contours of Core’s resurgence, we examine five critical questions. Each reveals where liquidity will originate, which markets will lead recovery and how investor behaviour is set to evolve.
1. Where is Core capital coming from?
Europe dominates by count, North America drives scale.
Core capital for 2026 is concentrated in two regions based on the Active Capital survey results, although the picture is more nuanced than headline numbers suggest. European-headquartered investors account for more than 70 per cent of those planning to target Core as their only or one of multiple strategies. However, may this partly reflects survey composition, as around 71% of all respondents have headquarters in Europe.
Analysing PERE, of the 27 PERE 2025 vintage core funds, 42% of institutions by value are based in Europe, 35% in North America and 20% APAC.
By scale, North America punches above its weight. While only 10 per cent of Core Active Capital survey respondents by number are headquartered in the region, they account for 18 per cent of planned Core investment. North American capital over the year ahead is likely to drive scale and accelerate early-cycle opportunities, particularly in Europe and select Asia-Pacific markets. For investors, the implication is that competition for prime assets will be shaped by governance priorities on one side and deployment speed on the other. Those who act early and who embrace collaborative structures to access complexity and scale, are more likely to secure a liquidity premium before it is fully priced in.
2. Which markets will Core investors prioritise first?
Gateway locations to lead the charge, Asia-Pacific adds selective growth.
The Active Capital Survey evidence points to a clear centre of gravity for capital which will target core as their only or one of multiple strategies in 2026. The UK and Germany dominate destination rankings, followed by France, Spain and the Netherlands. These markets combine liquidity, transparency and repricing, creating early-cycle entry points where pricing clarity and depth of demand converge. Among Core investors, the UK captures around 60% of planned Core allocations, signalling strong conviction in markets where governance frameworks and transparency align with income resilience. The UK has been the top destination for international capital in recent years and Germany the top mainland destination, underpinning their long-term liquidity.
Beyond Europe, Japan and Australia feature prominently. Both markets offer structural growth drivers and for Japan particularly, favourable debt costs, making Core strategies relatively more accretive relative to other geographies. This reflects a broader trend identified in the survey: investors are prioritising markets where swap rates and financing conditions support underwriting discipline, particularly for long-duration income streams.
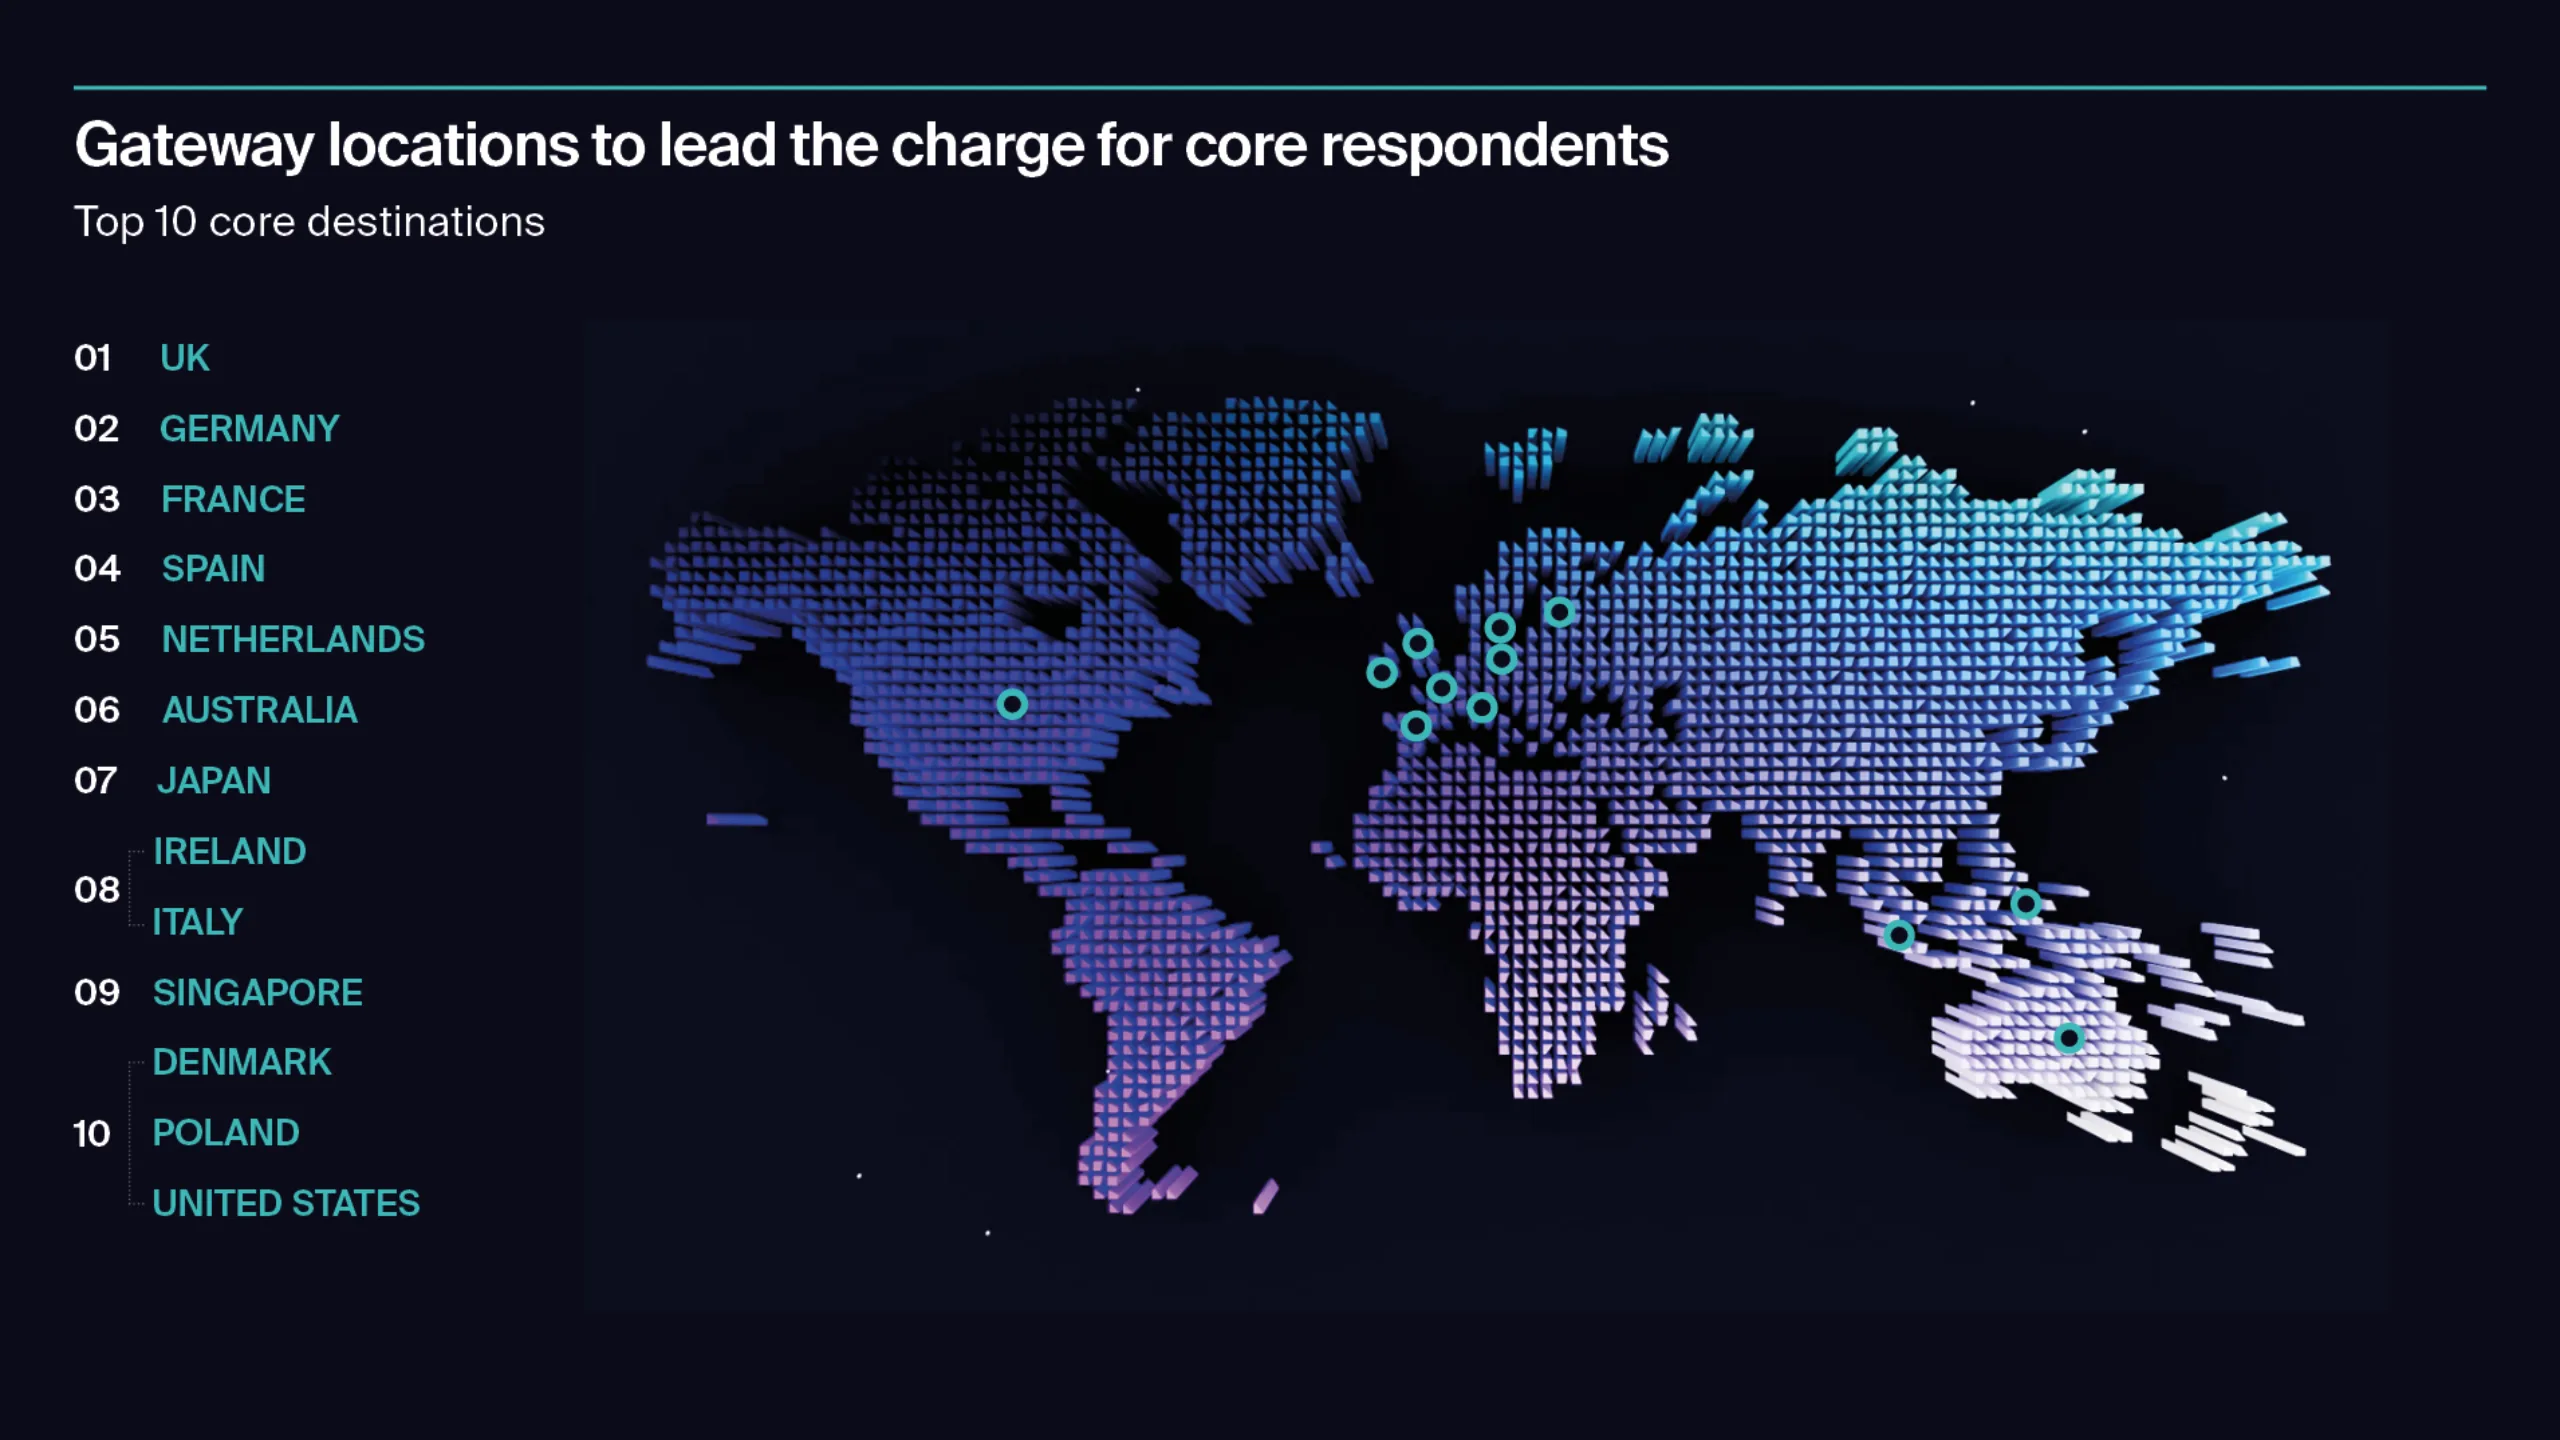
Source: Knight Frank
3. Which sectors will Core investors target?
Traditional sectors remain the anchor, with nuanced differences compared to the wider market.
The Active Capital Survey indicates that investors who are set to target Core as their only or one of multiple strategies will prioritise sectors that combine liquidity, income resilience and pricing clarity.
Offices: 63% of investors who will target Core, plan to invest in the offices sector. The most common office range of total investment for core investors is 10-20%, but just under 30% of investors will be targeting a higher proportion than this over the year ahead.
Living: 60% of investors who will target Core plan on investing in this sector, versus 65% overall. Core investors remain active in living sectors, particularly multifamily and co/flex-living, but with slightly less breadth than the wider market.
Industrial/Logistics: 59% of investors who will target Core plan on investing in this sector, versus 63% overall. While ‘traditional sectors’ are most frequently set to see core investors invest 10% to 20% in these, for Industrial / Logistics up to 40% of planned investment will be targeted by a significant proportion of core investors as well. This underscores that investors see a continued place for logistics in their portfolios driven by ongoing trade frictions and in some global locations, enhanced defence spending and continued e-commerce tailwinds.
Retail: 54% of investors who will target Core plan on investing in this sector, versus 56% overall.
Compared to the overall survey respondents, Core investors also indicate they plan to marginally narrow their sector focus, reducing from an existing average of five sectors to four in 2026. Despite this the results suggest some core investors will newly target Single Family rental, infrastructure and 'other'. While selective diversification into single-family rental and infrastructure is emerging, planned investment allocations remain relatively modest compared to traditional sectors apart from infrastructure, which is set to receive up to 20% of planned investment by investors.
Offices, logistics and living sectors will anchor allocations, while retail offers tactical upside in markets where repricing has created entry points and selective ‘newer’ sectors with structural tailwinds will provide exposure to underlying long term growth. For investors, this again indicates that early positioning in prime assets and readiness to act will be important, particularly in gateway locations and logistics hubs where competition for Core product is likely to intensify.
4. How is risk appetite shifting across strategies?
After years of rotation into higher-risk strategies, 2026 signals a structural rebalancing rather than a wholesale return to pre-pandemic norms.
Planned capital deployment for 2026 is split across the different risk strategies. 26% planned of investment is set to target Core ($37 billion), 23% Core Plus ($33 billion), 19% Value Add ($27billion) and 28% Opportunistic ($40 billion)1.
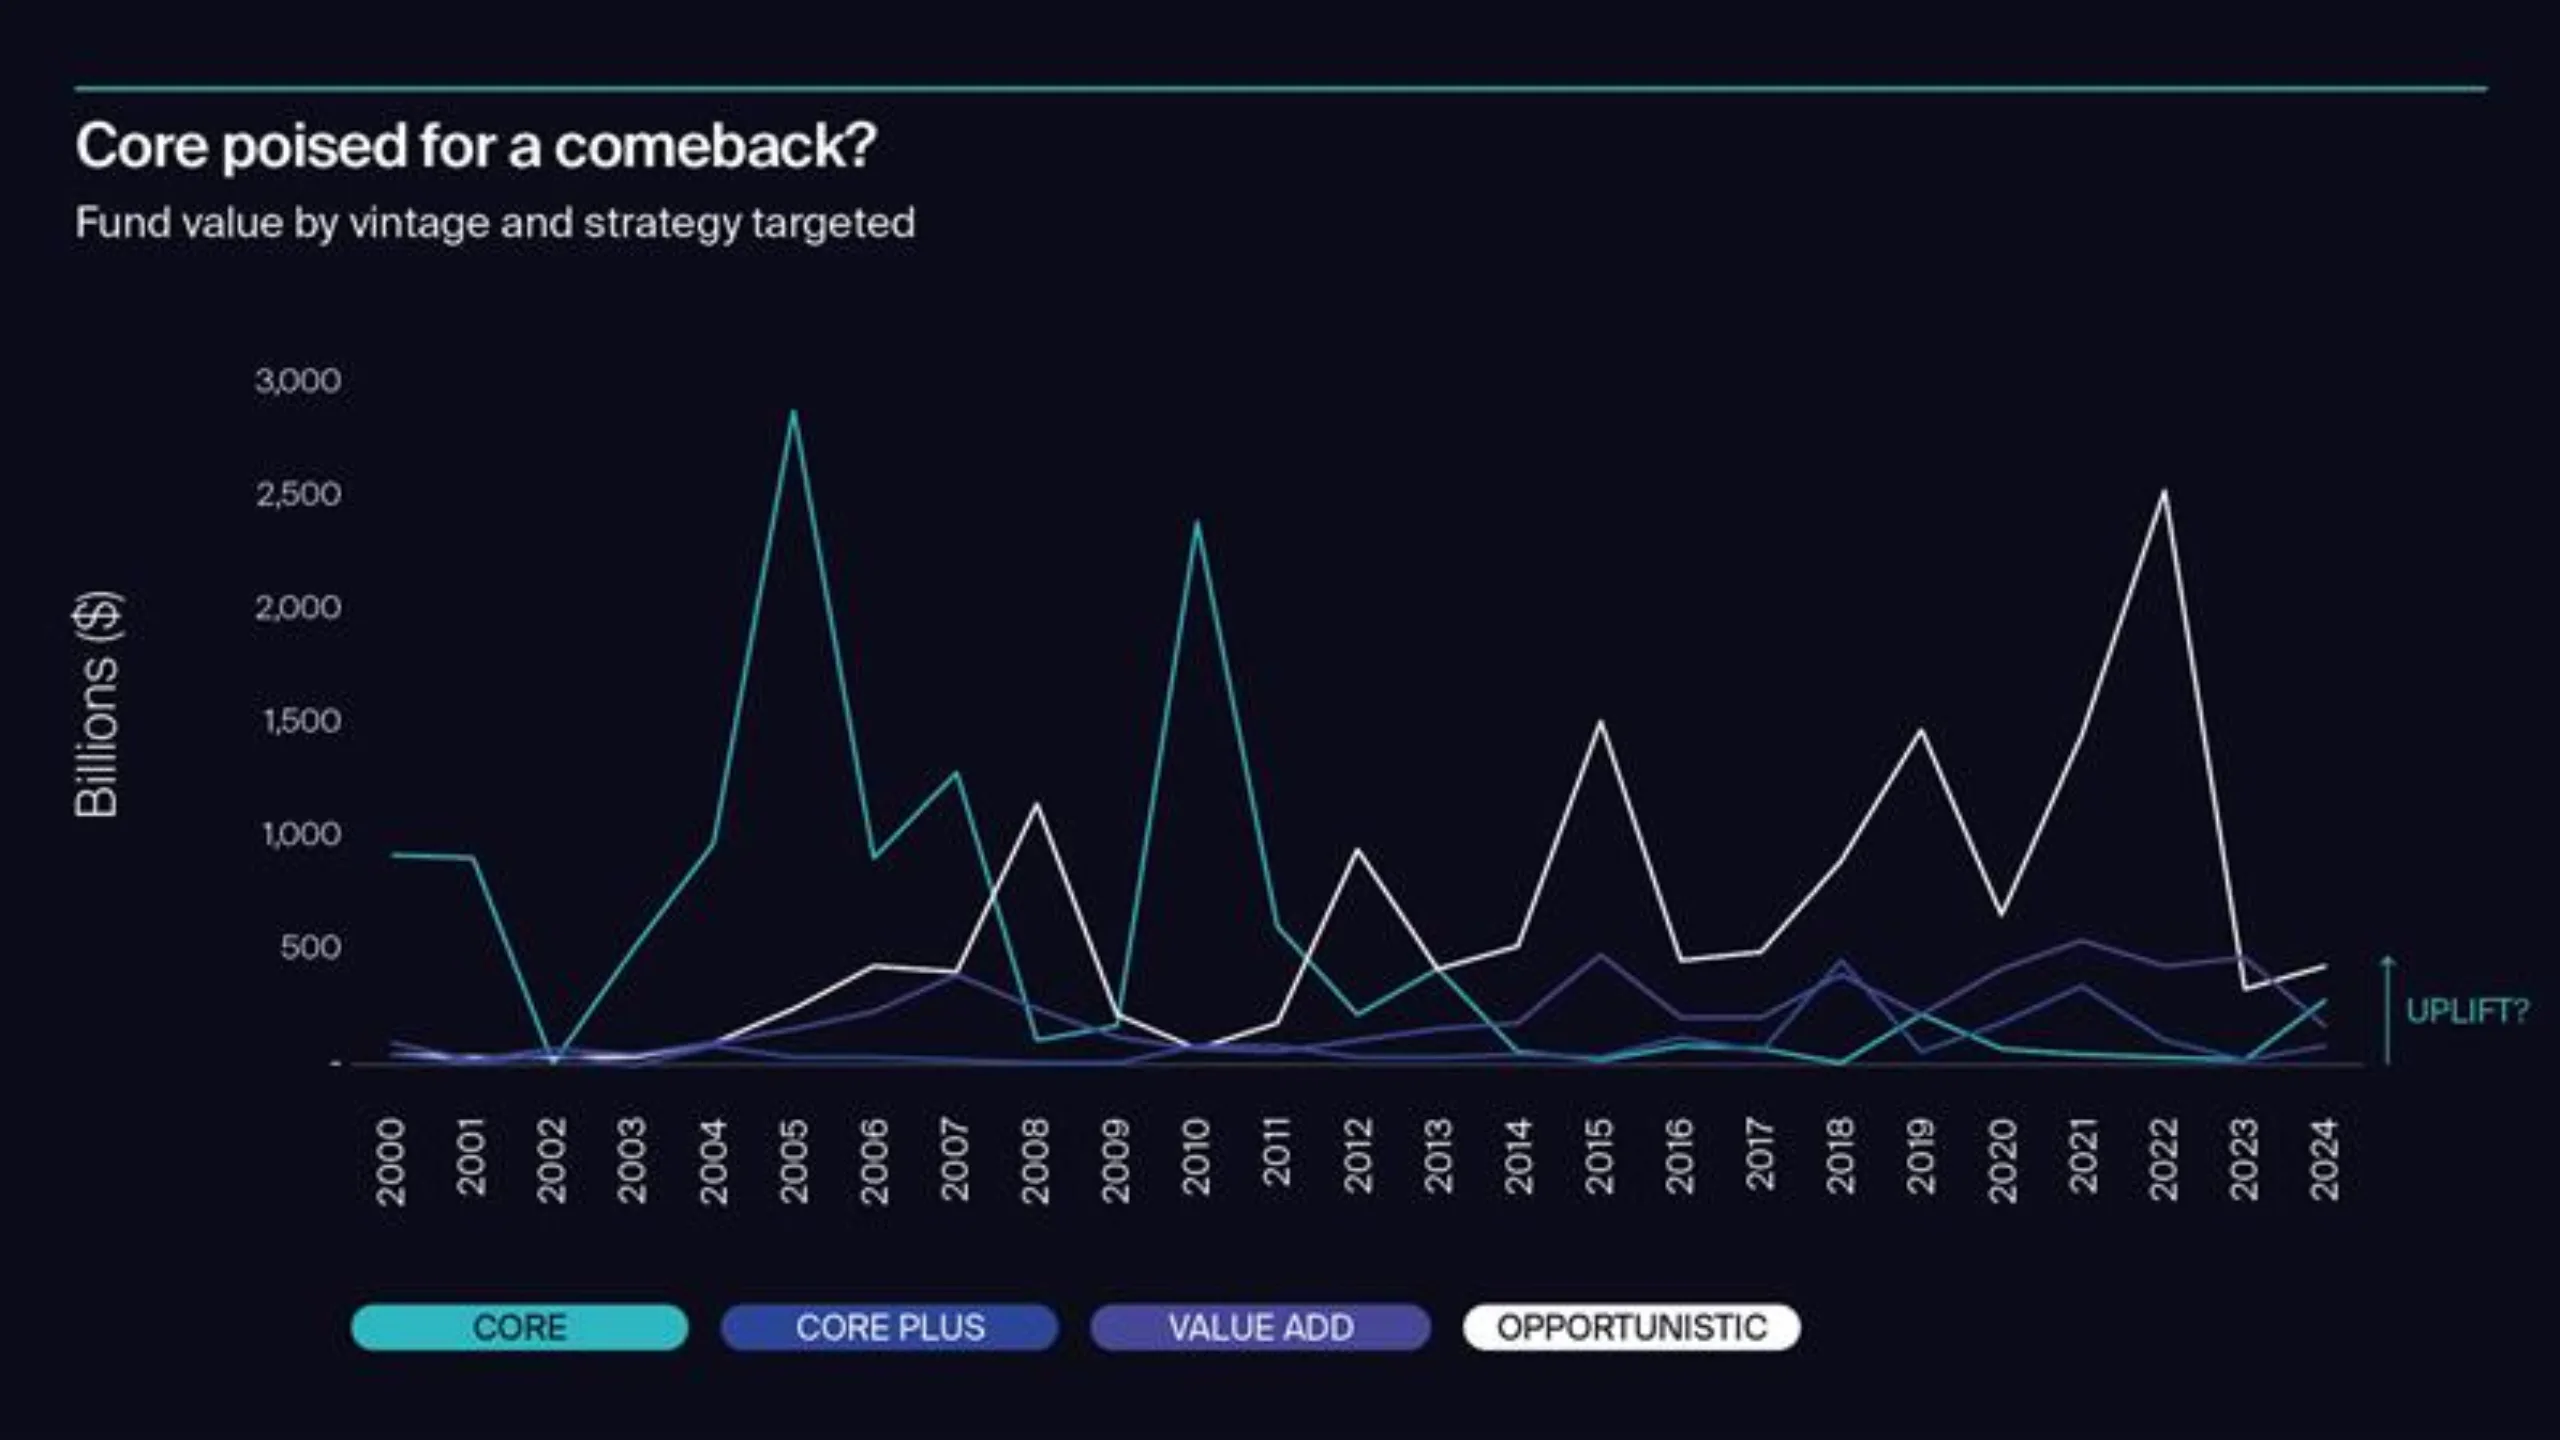
Analysis of PERE data by vintage year underscores this trend:
Timeline
Core dominance and stability: Recovery from the dot-com bubble and structural investor preference drives core.
Core strategies accounted for the largest share of fund size, reflecting a period of recovery from the earlier dot-com bubble, relative stability and economic expansion. Core strategies dominated due to structural investor preference, rather than the ultra-low cost of capital that defined the post-global financial crisis (GFC) cycle.
Pivot to Opportunistic
Opportunistic allocations increased, initially as investors sought higher returns in a crowded market, and then as they targeted distressed and repricing plays through the GFC.
Opportunistic capital peaks in 2021-2022
Opportunistic funds continued to capture the lion’s share of capital, peaking in 2021–2022, while Core and Core Plus strategies remained relatively niche.
Momentum starts to shift to lower risk strategies but opportunistic still dominates.
Early signs of moderation appear, with Core allocations increasing modestly, but Opportunistic still dominates absolute fund size in the PERE database.
Core poised for a comeback
Survey signals the start of rebalancing. Core set to find favour as debt costs ease, returns improve and investors gain confidence through an improving track record.
Core Plus leads intent for 2026, while core is predicted to anchor investment allocations
The Active Capital Survey finds that Core Plus will be targeted by 69% of respondents, but Core retains the highest average investment allocation at 51% of planned investment among those targeting it. Among investors planning to increase investment, Core is targeted by 76% by AUM.
This analysis reinforces the wider narrative - while fundraising trends have favoured opportunistic strategies mirroring the risk in Private Equity might, survey evidence suggests Core is regaining relevance in direct investment intentions, driven by stabilising debt costs, likely narrowing bid–ask spreads and a growing track record of performance. The interplay between historical capital formation and current investor behaviour highlights a critical question for 2026, will execution follow intent, especially given the high proportion (74%) of self identified net buyers targeting core?
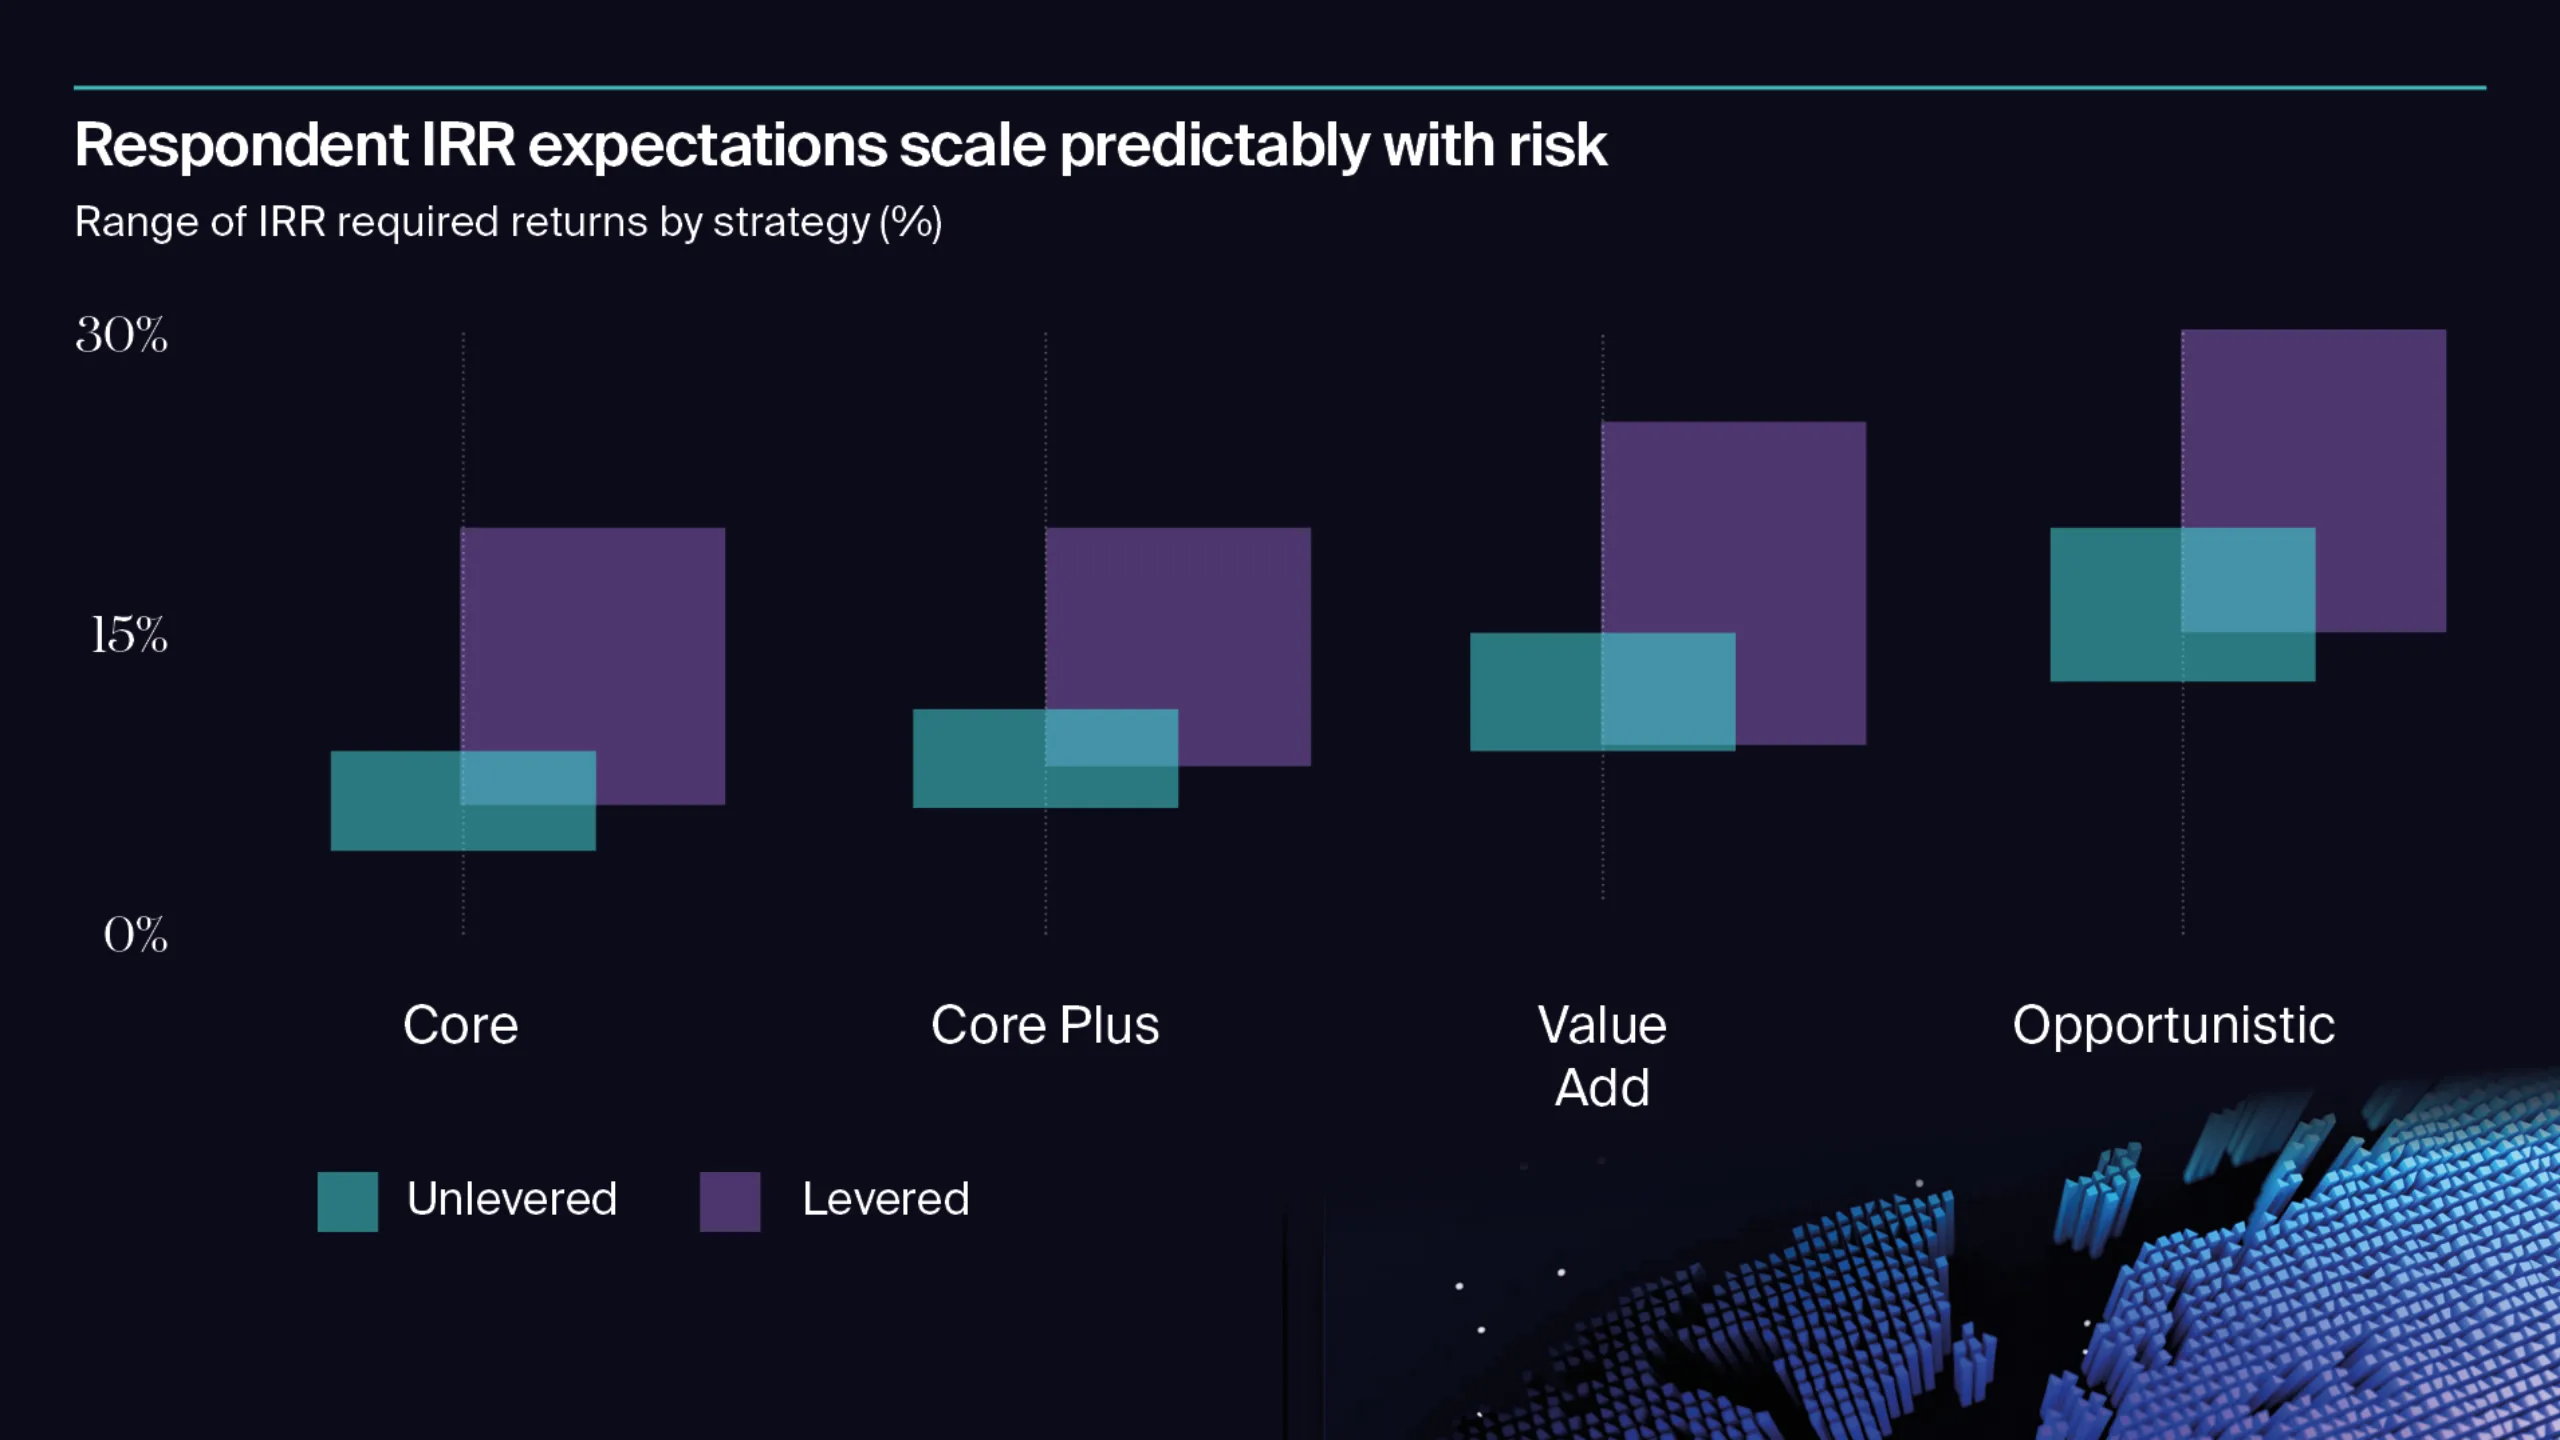
IRR return requirements match relative risk
Core strategies are set to continue to anchor institutional portfolios, supported by the lowest hurdle rates across the risk spectrum. Survey data indicates average unlevered IRR requirements of 7.4% (range 4%-9%) and levered IRRs of 9.5% (4% - 20%), compared with double-digit targets for higher-risk strategies.
Dispersion in core hurdle rates
Unlike Core Plus and Value Add, which exhibit relatively tight clustering, Core hurdle rates show wider dispersion across sectors and geographies. This reflects variations in risk-free rates and liquidity conditions. For example:
- Sectoral differences: Average levered Core IRRs range from ~7.5% (4% - 10%) for investors focused on student accommodation to 9%+ for those including offices and logistics (range 4 – 20%).
- Geographic variation: Investors targeting Australasia report average levered IRRs of 8.5% (range 4% - 10%), compared with 9.6% for Asia range(4% - 20%). These differences highlight Core’s heightened sensitivity to local interest rate environments and liquidity, where sovereign risk premiums and swap rates remain elevated.
Relative return
With government bond yields easing from recent highs, debt costs nudging lower, and pricing adjusting, Core’s 210bps differential between average unlevered and levered IRR target return is significant. The spread between Core and Opportunistic strategies of 10-12 percentage points on a levered basis, also remains material.
Incremental return requirements for leverage range from +2.1% for Core to +4.8% for Opportunistic, underscoring that investors less reliant on debt retain a structural advantage in competitive bidding. While this is most pronounced for higher-risk strategies, it also benefits Core investors who can deploy equity without leverage.
5. Who is set to invest in Core?
Investment managers dominate; institutions add weight.
The profile of Core investor-type adds another layer of insight. Investment managers dominate, representing 60 per cent by share of planned Core investment, underscoring their role as liquidity providers and execution specialists. Institutional investors account for 23 per cent by planned investment, reflecting stability, income and liability matching priorities. Multi-strategy investors dominate by number, particularly blending Core with Core Plus and Value Add.
Core’s strategic reset: Act early or miss the window?
Liquidity is returning, competition will define the winners.
Core is not just recovering, it is set to shape the investment playbook over the year ahead. With $37 billion of capital committed and 74% of core investors signalling net buying intent, the race for prime assets is on. Europe will lead by breadth, North America by depth, driving flows into gateway markets where transparency and repricing converge.
Stabilising debt costs and narrowing bid–ask spreads are set to enhance activity, but the imbalance between intent and available stock will intensify competition. Those who embrace partnerships and collaborative structures will secure scale and complexity before pricing fully adjusts.
This is not a “big bang” rebound, but it is a strategic inflection point. Core is set to reassert its role as the cornerstone of institutional portfolios, offering resilience and liability matching. For those prepared to act decisively, 2026 looks set to offer an opportunity to shape the next cycle.
Footnote
1 Does not total 100% as not all investors specified strategy percentages
Sign up to receive regular Active Capital insights.
Read more
Explore the rest of our Active Capital insights.

Active Capital
Welcome to the Knight Frank Active Capital Survey 2026
Investor sentiment is shifting from caution to conviction following higher interest rates, pricing uncertainty and constrained liquidity.
20 January 2026

Active Capital
The Knight Frank Active Capital Survey 2026: How investors plan to deploy $144bn
The survey reveals how capital flows, sector priorities and strategic positioning will shape 2026.
20 January 2026

Active Capital
Capital on the move: How optimistic investors are targeting direct commercial real estate in 2026
How optimistic investors are targeting direct commercial real estate in 2026.
20 January 2026

Active Capital
Sector strategy for 2026: Offices to anchor allocations as demographics and technology drive diversification
Offices will be the top targeted sector in 2026. Investors will likely focus on prime assets in core CBDs where there is income resilience.
20 January 2026

Active Capital
Capital strategies: Defensive anchors, opportunistic plays and the rise of partnerships
The Active Capital Survey 2026 indicates an investor base delicately balanced between caution and conviction.
20 January 2026

Active Capital
Core capital returns: The outlook for core liquidity, recovery and strategy in 2026
Core investment is set to regain momentum, driven by stabilising debt, narrowing bid–ask spreads and improving return profiles.
20 January 2026

Active Capital
From core to complexity: What investor hurdle rates tell us about 2026
Investor hurdle rates follow a hierarchy across strategies. The gap shows liquidity, complexity, execution risk and market volatility.
20 January 2026

Active Capital
Investor opportunities: Prime offices, repricing plays and structural growth sectors
Respondents to the survey identify three dominant opportunity clusters shaping investor strategy for the year ahead.
20 January 2026

Active Capital
Top themes: Seven forces shaping capital decisions in 2026
The Active Capital Survey 2026 identifies seven tightly clustered forces that will define investment decisions in the year ahead.
20 January 2026