

The UK Residential Market in Five Charts
What are the forces shaping the UK residential property market less than a fortnight from the Budget?
16 October 2026

In a marked change from last year, speculation around property taxes has been fading ahead of the Budget.
First, the Chancellor has reportedly decided against reducing the lower threshold for the high-value council tax to £1.5 million from £2 million.
Perhaps a policy that would impact its voter base in London was deemed too risky by the Labour government. Perhaps dropping the threshold by £500,000 before the legislation had even come into effect was seen as a step too far.
We explored the disproportionate effect of a so-called mansion tax on different parts of the country here.
A plan to align capital gains tax (CGT) and income tax has also reportedly been dropped. While this is good news for landlords, Chancellor John Healey could still tweak CGT allowances and reliefs or make rental income subject to national insurance, as discussed on a recent episode of Housing Unpacked with former Treasury special adviser James Nation.
While Budget speculation de-escalates, the Middle East conflict has shown no sign of doing the same, which has kept upward pressure on mortgage rates, as we explored here.
As hostilities continue, concerns have increasingly centred on the rising cost of refined products like diesel, as discussed on the latest episode of Housing Unpacked with financial market analyst Michael Brown.
Inflation expectations have risen, which has pushed up Bank Rate projections, and the five-year SONIA swap rate closed at 4.76% on Monday, Bank of England data shows. It was the highest close in more than two years.
Given these mixed signals less than a fortnight before the Budget, below are five charts that show which forces are currently shaping the residential property market.
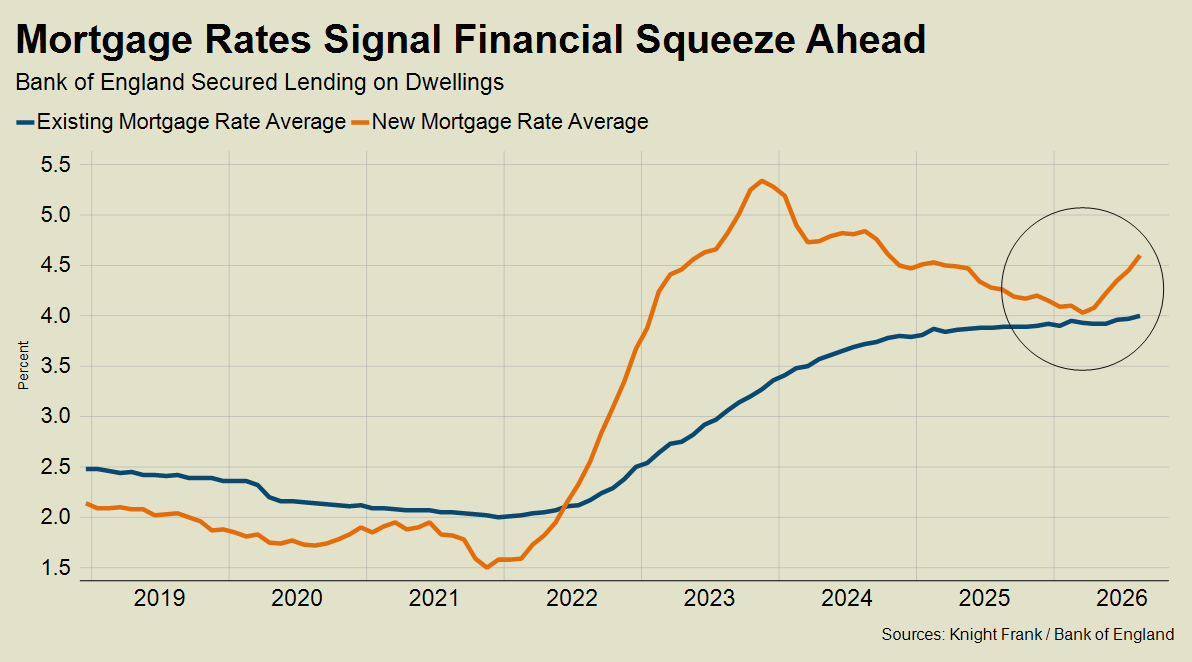
1. The first chart highlights the growing gap between the average mortgage rate paid by borrowers (4.0% in August) and the average new rate issued by lenders (4.6%), according to the Bank of England. The difference between the two underlines the additional financial burden facing anyone remortgaging and shows how budgets will be squeezed for anyone moving house.
The result will be downward pressure on prices and transaction volumes. The discrepancy between existing and new mortgage costs was greater in 2022 and 2023, when interest rates began normalising after being ultra-low for more than a decade. It narrowed sharply earlier this year as swap rates fell, but the Middle East conflict reversed that trend. As the next chart shows, the outlook for the market hinges on how the war unfolds.
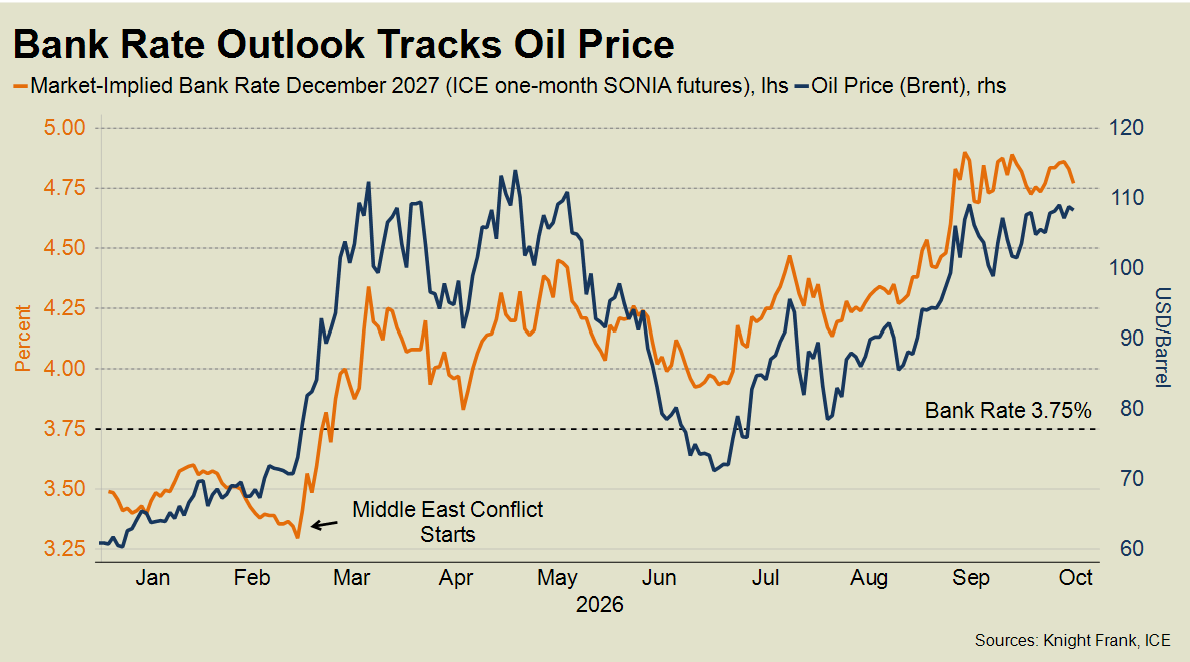
2. For anyone attempting to anticipate the trajectory of the housing market, energy prices are a good place to start. Since the Middle East conflict began in February, Bank Rate expectations and energy prices have been closely aligned, as this chart shows. Other factors that can move inflation expectations include food prices, wage growth and the value of the pound. Markets are currently pricing in between four and five quarter-point hikes by December 2027.
Fixed-rate mortgages, which account for 87% of outstanding mortgages in England, are priced from swap rates, which are driven by where markets think Bank Rate is heading. Because these bets are currently so closely linked to oil price movements, the latter has a strong bearing on mortgages, house prices and transaction volumes. Although the outlook for the housing market hinges to a great extent on a single overseas geopolitical risk, it means mortgage rates could fall quickly if the conflict de-escalates or ends.
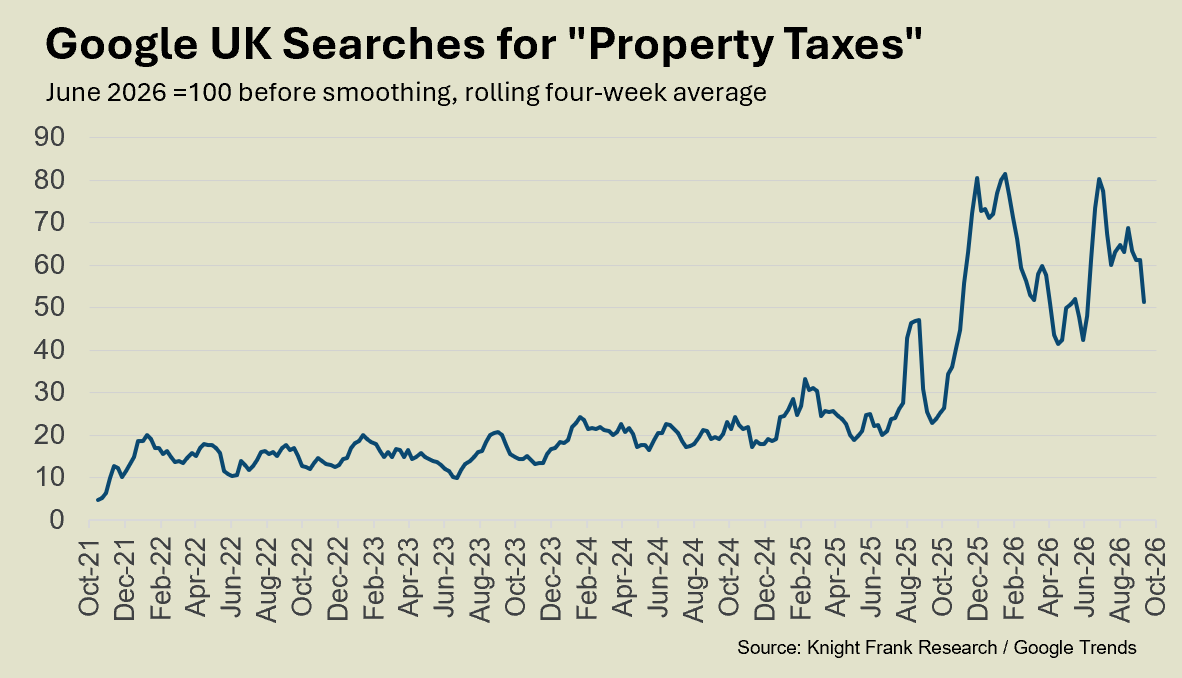
3. Political uncertainty is the other factor weighing on demand and it has increased sharply since the summer of 2025, when a period of speculation began around which property taxes the Chancellor would increase in the Budget that year. The rumours since then have included capital gains tax on primary homes above £1.5 million, a so-called proportional property tax and lowering the bottom threshold for the high-value council tax to £1.5 million from £2 million. None of these three have happened, but the speculation itself has deterred buyers.
The number of searches on Google UK for the term “property taxes” has risen as a result. However, as the chart shows, a sense of uncertainty now appears to be embedded, even between Budgets. The government has little room to borrow more on the bond market without pushing debt servicing costs higher, no political latitude to cut spending meaningfully and is still hemmed in by pledges not to raise VAT, income tax or national insurance made in its 2024 election manifesto. Hence the recurring menu of smaller tax raising options that buyers and sellers read about year after year.
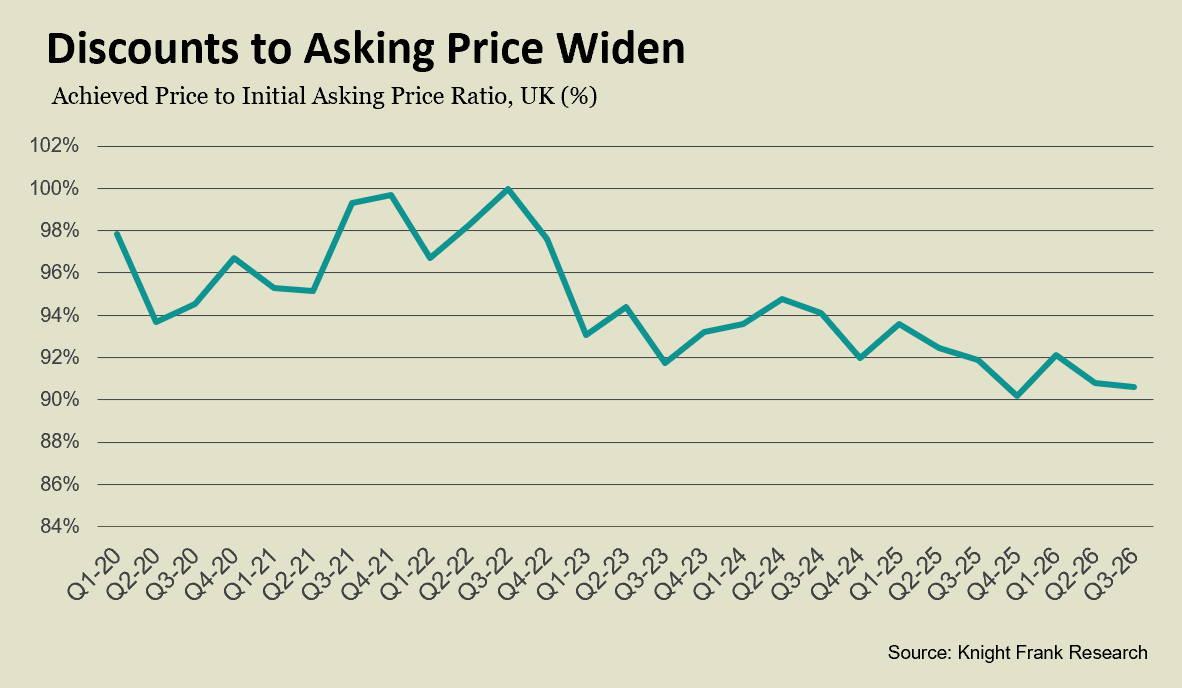
4. As a result of higher mortgage rates and the mood of political uncertainty, prices have come under pressure. Average UK prices were flat in September this year, which compares with +5% in September 2024, according to Lloyds.
This downward pressure has forced sellers to accept bigger discounts, as this chart shows. Properties that exchanged contracts in Q3 2026 sold for an average 91% of their initial asking price, Knight Frank data shows. That compares with higher ratios in 2021 and 2022, when demand was fuelled by the pandemic-era stamp duty holiday, the “race for space” and cheaper mortgages.
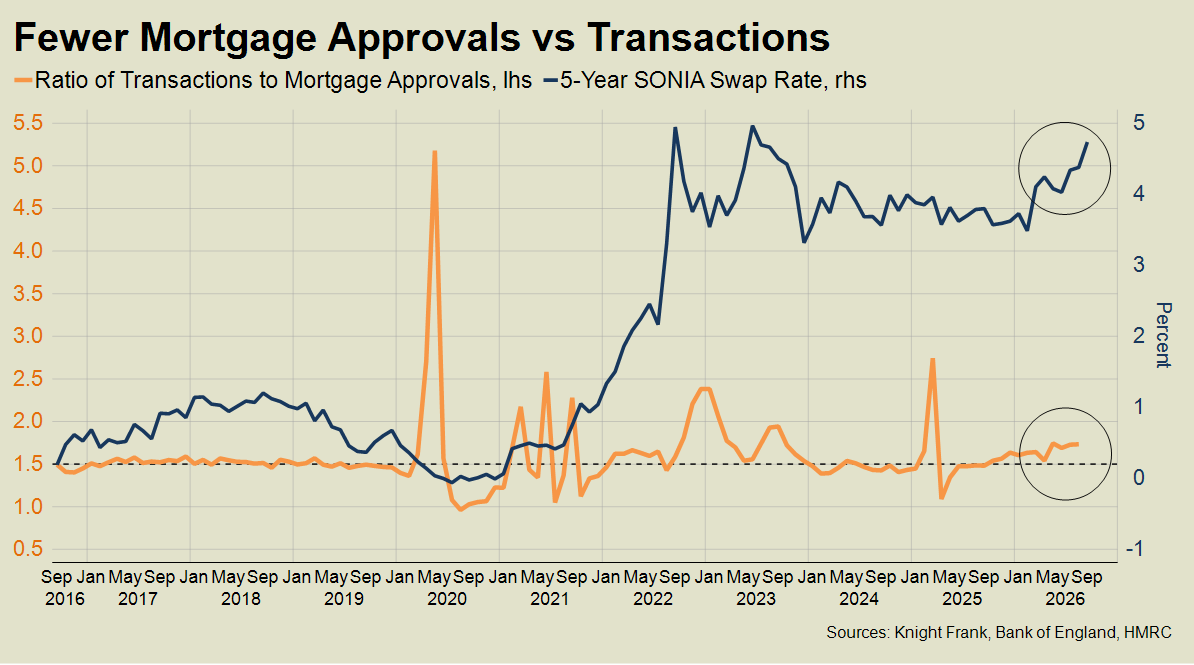
5. The final chart suggests sales volumes will come under pressure, with the bottom line showing the ratio between transactions and new mortgage approvals. A higher ratio can indicate that sales are being supported by existing approvals, but new approvals are falling away. Mortgage offers can last for six months, which means the impact of lower approval numbers can be delayed before gravity hits.
The ratio rose to 2.4 in December 2022, three months after the mini-Budget. By May 2023, transactions had fallen to 78,400, HMRC data shows. Outside of the pandemic and stamp duty holidays, that was the lowest figure since October 2012. The ratio was 1.7 in August, up from a typical pre-Covid level of about 1.5. The sharp increases in 2020, 2021 and 2025 are related to Covid and stamp duty cliff edges.
The top line shows the five-year SONIA swap rate, according to the Bank of England. The two lines indicate how higher mortgage costs eventually weigh on transaction numbers.
Sign up to Knight Frank Research.
