

Site selection
16 June 2026
The harvest in 2024 tested the strategic decision to be a single estate wine producer.
The romanticism of these wines being an undiluted expression of the estate’s terroir is a key thread that embodies the story of many premium single estate wine producers, but it does leave you exposed if site selection has not been done thoroughly.
Producers who have elected for a strategy to source grapes from multiple growers from different counties probably breathed a sigh of relief when clean, ripe grapes from partner producers on warm, dry vineyards turned up at the winery. Sourcing fruit in this way gives a plan B, C and D if the harvest at home proves challenging.
Every now and again, on LinkedIn, we saw posts about fruit being harvested from selected sites along the North Downs in Kent and in East Anglia that had clean, abundant fruit with high natural alcohol levels. Duncan McNeil, who works with many growers in East Anglia, posted a few images of his clients’ fruit bins full of Burgundian clone pinot noir and chardonnay that look like they were picked in 2018, one of the best years on record.
I was relieved when several of our clients told us that the vineyards we had helped them identify fared well against the backdrop of many others’ harvests, and that they had been able to source fruit with good ripeness levels. This was, after all, why we identified them in the first place, but it takes a year like this one to prove that the careful site selection process is worth the patience and effort.
This article therefore shines a light on our site selection criteria, and the exacting and data-first process we follow when acting on behalf of our clients.
I can remember exactly where I was when Dr Alastair Nesbitt gave a presentation on the link between harvest quality and growing season weather patterns. We were in the first-floor presentation room at Denbies Wine Estate, and I was sitting one row from the front. He asked the room for their opinion on what was the single most influential independent weather variable was that impacted harvest quality. Temperature, frost risk and sunshine were the main answers volunteered. The answer was rainfall in early July. I hadn’t seen that coming. Heavy rainfall in July dislodges the petals on the vines during flowering, which lowers the effectiveness of pollination. This weakens the fruit set, which is the determining factor of the quantity and quality of the grape bunches.
Similarly, I can remember where I was when Oz Clarke listed villages along the Kent Downs he thought might one day become the key wine growing regions in the county. Lenham, Hollingbourne, Harrietsham, Thurnham, Detling… like he was recalling songs from his favourite album. It was at the opening of Simpsons Wine Estate winery in Barham. These villages track the Pilgrims Way, on an even south-facing slope with a gradient of about 5-8 degrees, that rise to an elevation of about 100m above sea level over loam over chalk.
These experiences were formative for me, as you can probably tell, so I decided to try and understand if we could display these meteorological and geological characteristics on a map, to help wine producers find the best sites in the country for growing grapes. Fortunately, we have a data analytics team in Knight Frank who were up for the challenge.
The images and tables here are the output of our Vineyard Mapping platform.
We use this data to help clients identify land suitable for vines and give you an insight into the process we rely on to help clients identify land suitable for vines.

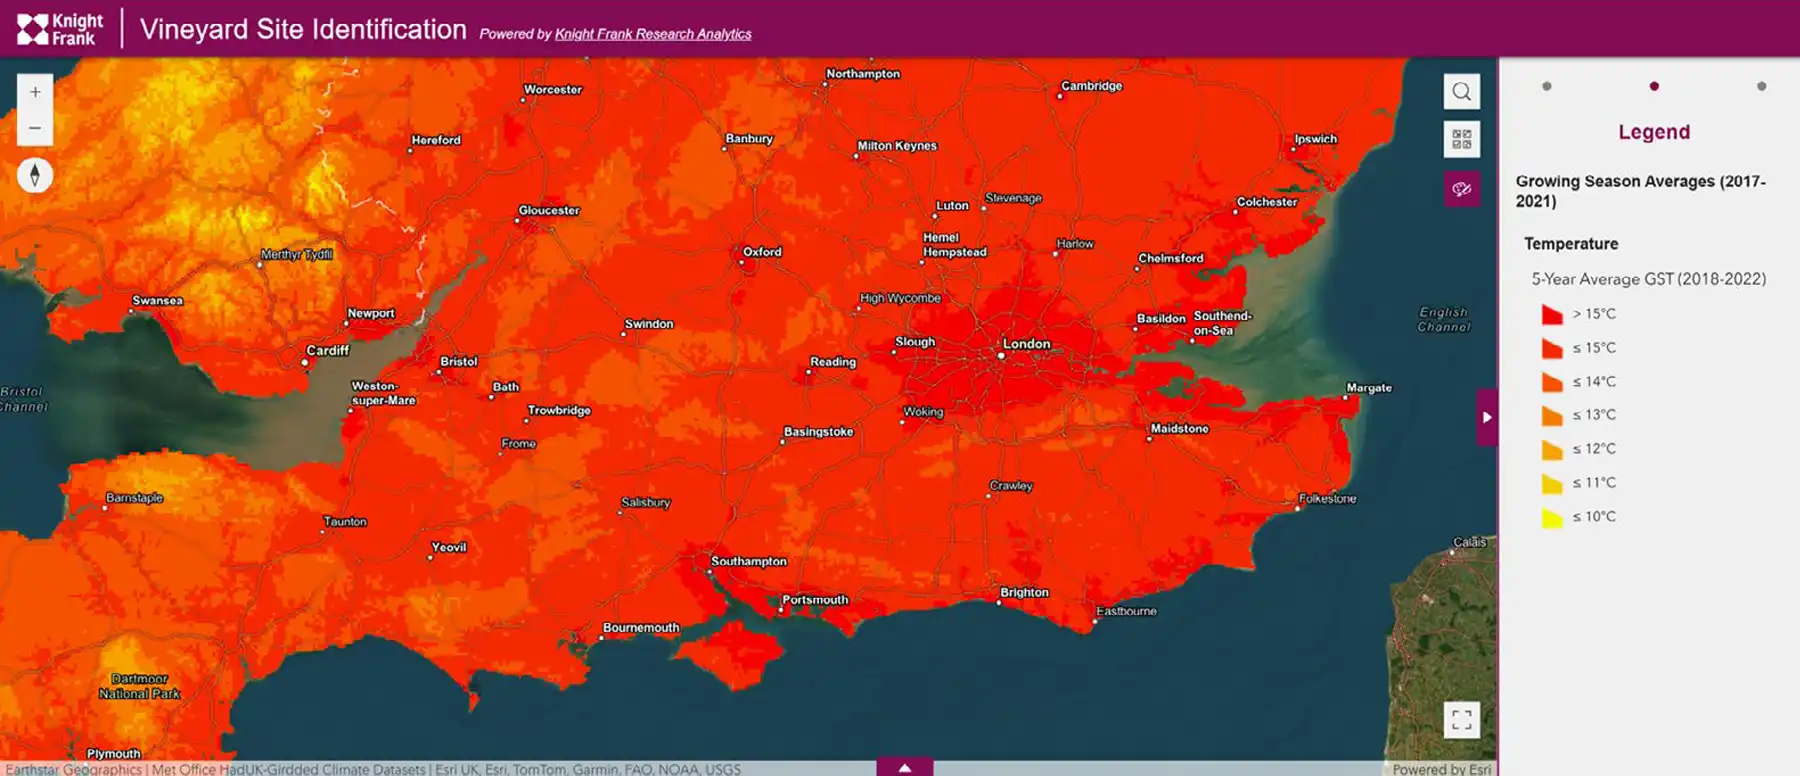
Growing Season Temperature (GST) is the average temperature between 1st April – 31st October which is the growing season for vines in the northern hemisphere. The hotter areas in the UK are shown with a brighter red on the map above, whereas cooler areas are shown as yellow or orange. You can see from the map that the southeast has a noticeably higher GST than parts of the west and into Wales.
Each grape variety has its own ideal growing season temperature range. The trio of traditional method sparkling wine grapes which are most prevalent in the UK by volume are chardonnay, pinot noir and pinot meunier. These are all cool climate grapes, and have a GST range of between 13.5 - 16.5 deg C. You may have come across other grape varieties being grown in cooler or wetter parts of the UK, and that is probably because they have been selected to match the growing season temperature in that area. For instance, solaris is a grape variety that copes well in cool and wet areas and would be quite happy growing on the north face of Ben Nevis.
Generally, the higher the GST the better, as higher temperature increases the sugar content which determines the level of natural alcohol in the grapes, gives is a more balanced acidity level and creates the interesting complexity of flavours in the wine. Grapes grown in cooler climates often need the alcohol artificially increased by adding sugar post-harvest, through a process called dosage.
The table below highlights the warmest counties in the United Kingdom by Growing Season Temperature. We would select against counties with a GST of less than 14.0 deg C.
|
County |
GST |
|
Isle of Wight |
14.7 |
|
Essex |
14.5 |
|
Kent |
14.4 |
|
East Sussex |
14.4 |
|
Suffolk |
14.3 |
|
Cambridgeshire |
14.3 |
|
West Sussex |
14.3 |
|
Surrey |
14.3 |
|
Hertfordshire |
14.3 |
|
Hampshire |
14.2 |
|
Bedfordshire |
14.2 |
|
South Glamorgan |
14.1 |
|
Berkshire |
14.1 |
|
Norfolk |
14.1 |
|
Buckinghamshire |
14.0 |
|
Worcestershire |
14.0 |
|
Merseyside |
14.0 |
|
Oxfordshire |
14.0 |
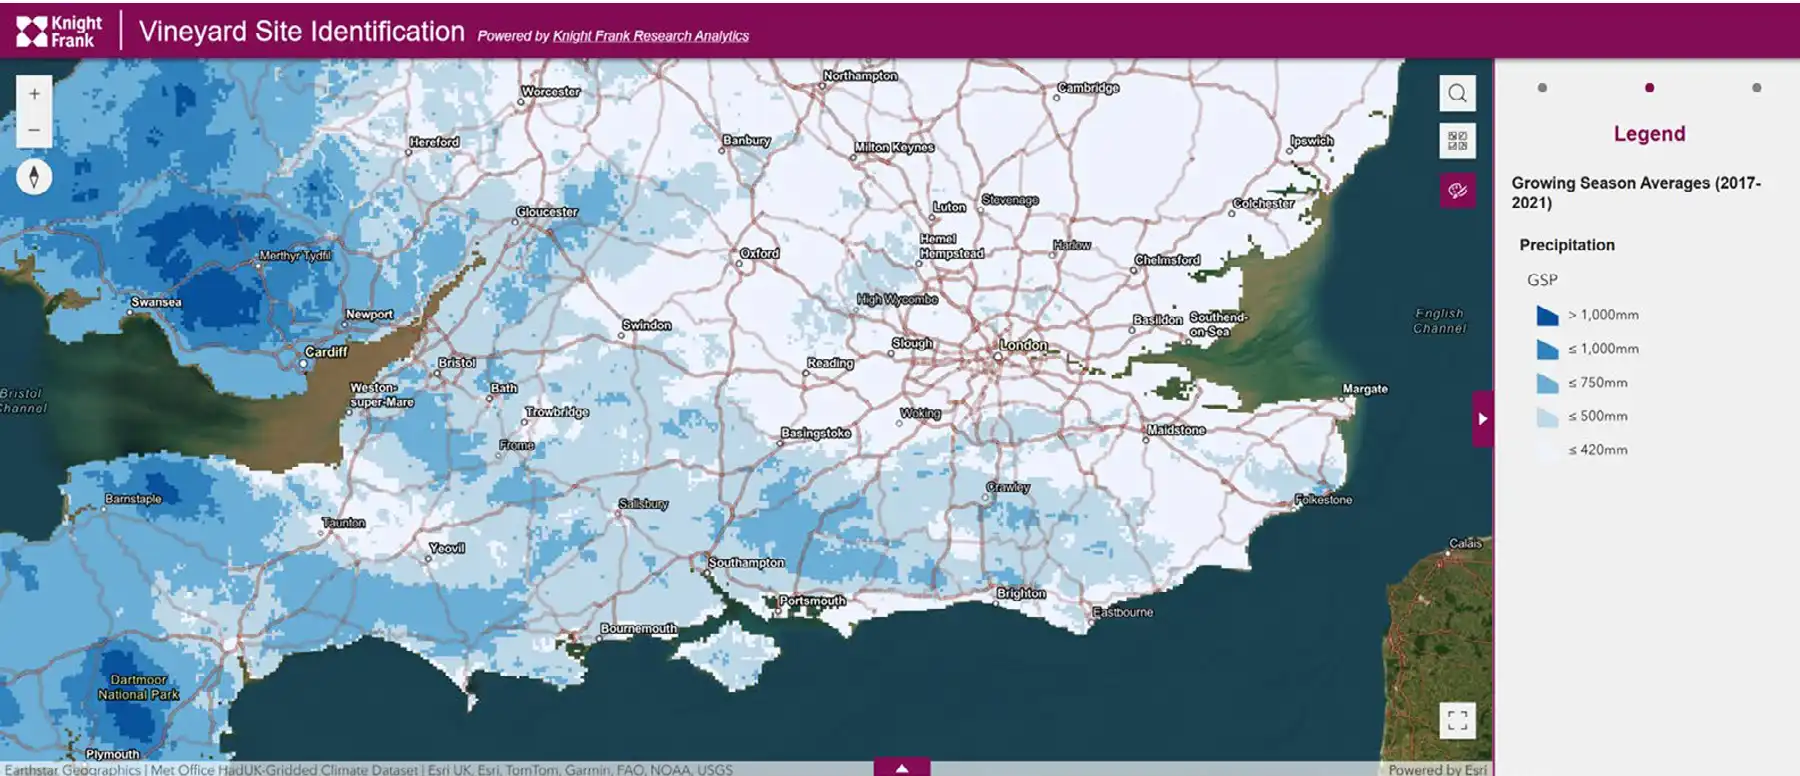
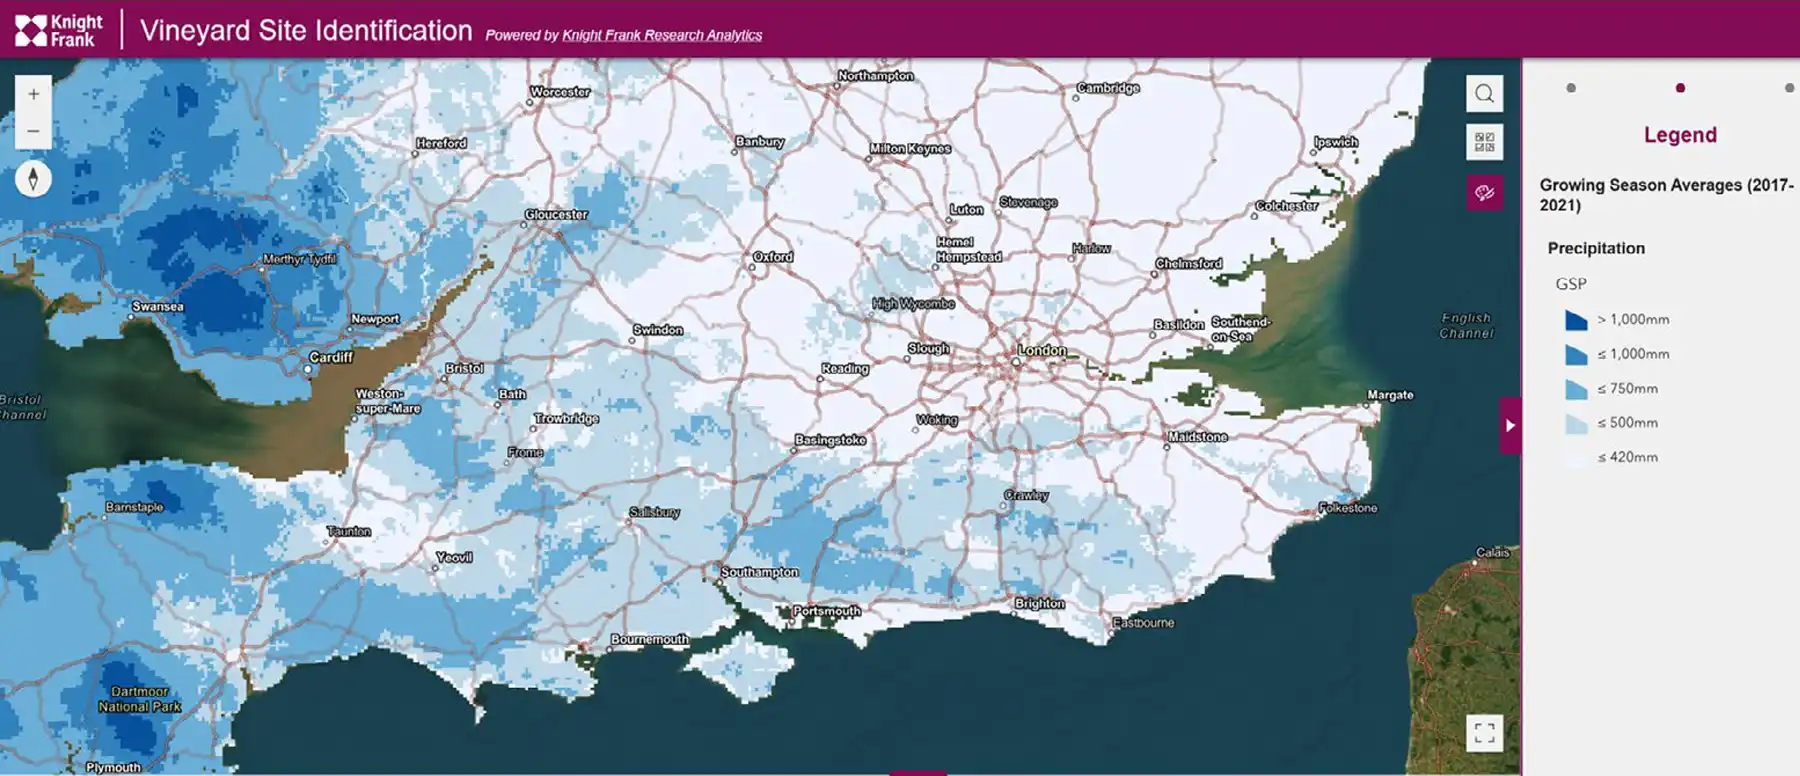
Growing Season Precipitation (GSP) is the average amount of precipitation between 1st April – 31st October in the northern hemisphere. The UK has a maritime climate, and we get a lot of rainfall relative to other wine growing regions.
The map above shows the variation in rainfall in the UK during the growing season. The darkest areas of blue experience more than 1,000mm of rainfall, which is more than double the <420mm of rainfall experienced in lightest blue shaded areas like East Anglia.
Precipitation presents two threats to vineyards. High precipitation during flowering can affect pollination as we learnt from Dr Nesbitt. The second threat is that wet vineyards have higher mildew and disease pressure. This also has a financial impact, as wetter sites have a higher spray usage, increased labour requirements, and increased machinery hours, all culminating in a higher operating cost. For this reason, we try to select counties that have less than 420mm of precipitation during the growing season.
The table below highlights the top 20 counties in the United Kingdom by Growing Season Precipitation. The data is sorted in ascending order, with the driest counties at the top. Growing Season Temperature is also plotted on the table and the data is conditionally formatted to show GST of less than 14.0 deg C in amber and less than 13.5 deg C in red.
|
County |
GST |
GSP |
|
Suffolk |
14.3 |
332.14 |
|
Essex |
14.5 |
343.38 |
|
Cambridgeshire |
14.3 |
345.36 |
|
Bedfordshire |
14.2 |
360.31 |
|
Norfolk |
14.1 |
371.66 |
|
Kent |
14.4 |
378.46 |
|
Northamptonshire |
13.8 |
386.36 |
|
Hertfordshire |
14.3 |
387.45 |
|
Lincolnshire |
13.8 |
391.10 |
|
Rutland |
13.6 |
391.85 |
|
Berkshire |
14.1 |
392.25 |
|
Oxfordshire |
14.0 |
393.55 |
|
Buckinghamshire |
14.0 |
394.53 |
|
Nottinghamshire |
13.9 |
398.38 |
|
Warwickshire |
13.8 |
399.33 |
|
Tyne & Wear |
13.0 |
401.66 |
|
Leicestershire |
13.6 |
408.53 |
|
Worcestershire |
14.0 |
410.38 |
|
East Riding of Yorkshire |
13.3 |
417.12 |
Before any vineyard managers throw their laptops or devices at the wall in disgust, I hasten to say that ground frost occurring at any point during the growing season is not the frost events that cause critical threat to vineyards and that spring wine producers up from their beds at ungodly hours in the night to light hundreds of candles in the vineyard rows to protect against frost damage. These events are air frosts which happen in late April or early May when the new growth of young leaves is particularly vulnerable.
Knight Frank’s Met Office API link only shows ground frost data, however it is a useful proxy for air frost risk, so we use it in our site selection work.
The map above shows the variety of ground frost events in the UK during the growing season. You can see that generally coastal regions have the least amount of ground frost, so you might think that selecting vineyards near the sea would be a good strategy, however you then run into the risk of choosing sites with high wind exposure, which creates its own problems.
Selecting the appropriate threshold of ground frost risk is an art, not a science. We have decided to select for inland sites that have less than 40 ground-frost events during the growing season, as they are the sites which have the least air frost exposure too.
The table overleaf highlights the top 20 counties in the United Kingdom by Groundfrost days with the data sorted in ascending order. There are some surprising counties in there, many of which are coastal, and which throw up some interesting GSP and GST stats, so GST is conditionally formatted to be amber if less than 14.0 deg C red if less than 13.5 deg C and GSP shows more than 450 mm in amber and more than 500mm in red.
|
County |
GST |
GSP |
Groundfrost |
|
Isle of Wight |
14.7 |
437.27 |
16.99 |
|
West Glamorgan |
13.6 |
843.24 |
18.30 |
|
South Glamorgan |
14.1 |
628.60 |
20.73 |
|
Cornwall |
13.7 |
620.08 |
23.36 |
|
Essex |
14.5 |
343.38 |
24.63 |
|
Merseyside |
14.0 |
520.15 |
25.47 |
|
Mid Glamorgan |
13.0 |
932.41 |
25.63 |
|
Shetland |
10.2 |
567.01 |
26.14 |
|
East Sussex |
14.4 |
439.29 |
27.15 |
|
Orkney |
10.8 |
545.82 |
27.25 |
|
Gwynedd |
12.4 |
950.21 |
27.51 |
|
Devon |
13.5 |
638.98 |
28.23 |
|
Kent |
14.4 |
378.46 |
28.36 |
|
Suffolk |
14.3 |
332.14 |
28.56 |
|
Gwent |
13.5 |
630.36 |
28.69 |
|
Hertfordshire |
14.3 |
387.45 |
28.70 |
As you incorporate more data sets you find that counties start to become discounted due to low temperatures, high rainfall or the number of frost days. The following table shows the top counties that score consistently well across the three categories.
|
County |
GST |
GSP |
Groundfrost |
|
Essex |
14.5 |
343.38 |
24.63 |
|
Kent |
14.4 |
378.46 |
28.36 |
|
East Sussex |
14.4 |
439.29 |
27.15 |
|
Hertfordshire |
14.3 |
387.45 |
28.70 |
|
Suffolk |
14.3 |
332.14 |
28.56 |
|
Cambridgeshire |
14.3 |
345.36 |
29.20 |
|
Bedfordshire |
14.2 |
360.31 |
30.43 |
|
Surrey |
14.3 |
420.73 |
33.61 |
|
Isle of Wight |
14.7 |
437.27 |
16.99 |
|
Worcestershire |
14.0 |
410.38 |
32.53 |
|
Buckinghamshire |
14.0 |
394.53 |
34.44 |
|
Norfolk |
14.1 |
371.66 |
31.57 |
Many of these counties are in East Anglia. It was perhaps no surprise then that we learnt in the summer of 2023 that Jackson Family Wines had selected a farm in Althorne in the Crouch Valley in Essex to plant a vineyard where they plan to make premium Burgundian style still chardonnay and pinot noir. Knight Frank acted for the vendors in that transaction, and this article highlights why it was chosen. Its first redeeming characteristic was its soil.
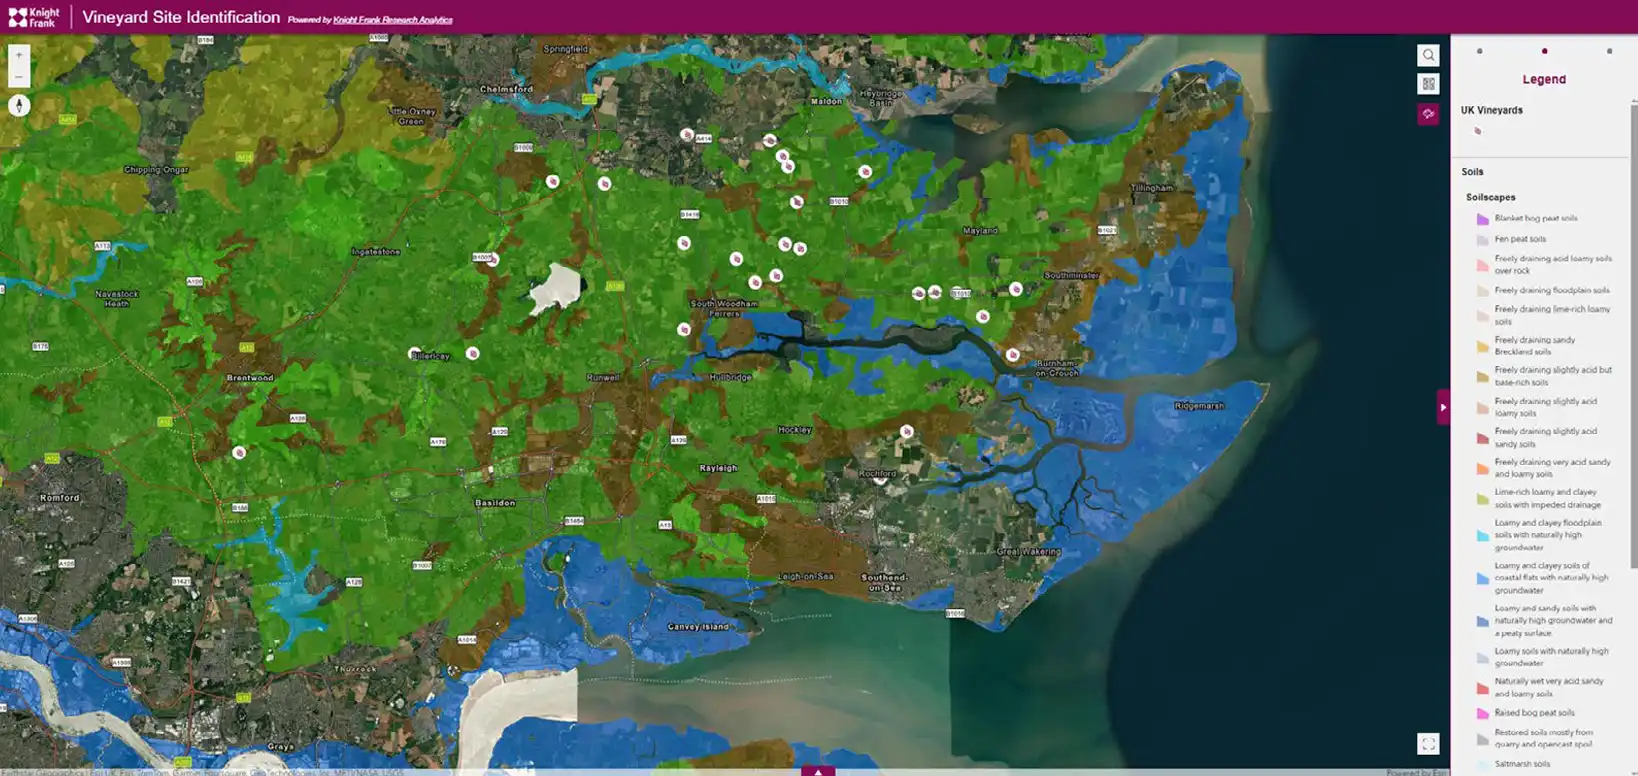
The map above shows different soil types overlaid over a base map of Essex. The grape icons show the location of vineyards in the county. Most of them are over the green shaded soil type, which represents slightly acid but base-rich loamy and clayey soils. These soils typically have very high levels of vigour, which
characteristically produce wine with ripe fruit flavours. In many ways the Crouch Valley is very similar to the Côte d’Or, famous for its Burgundian style pinot noir and chardonnay, known for their elegance and finesse.
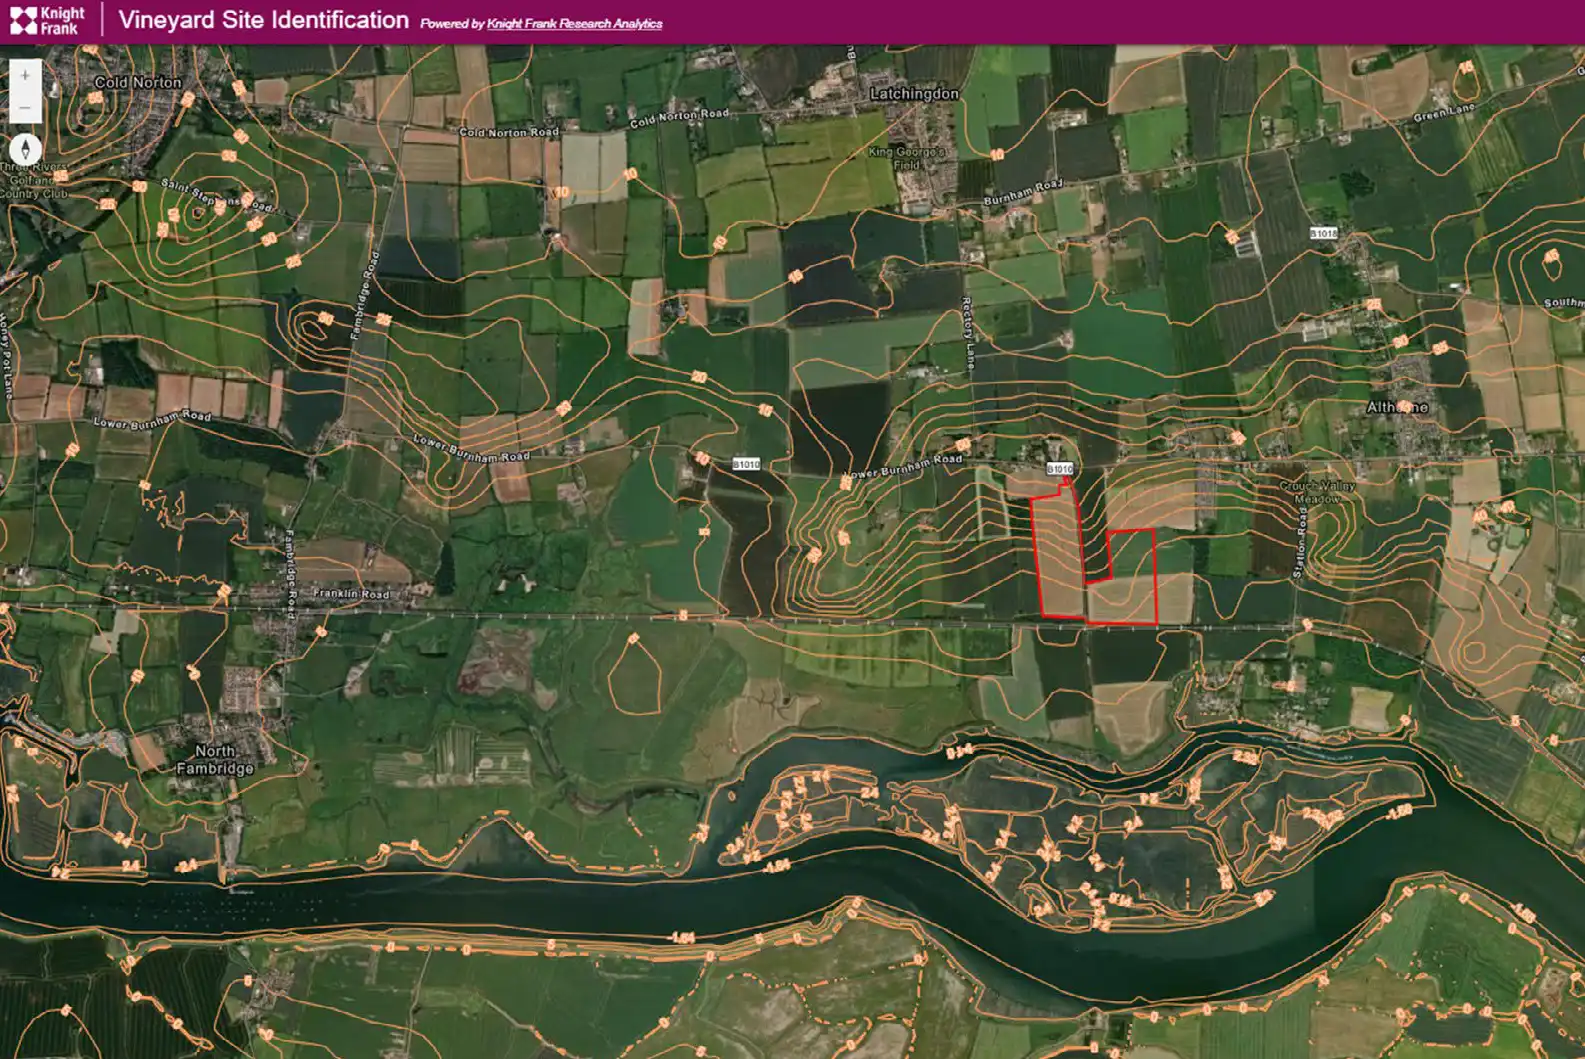
The other characteristic of the site that made it suitable for grape production is the elevation and slope orientation of the ground. This is demonstrated in the contour map, above. Grange Farm, which Jackson Family Wines bought, is outlined in red.
As vineyard agents, we search for land below 100m above sea level, sloping towards the south, with an even ground level surface. We select within this altitude as wind exposure reduces temperature by approximately 1 deg C for every 100m in elevation. There is an interesting harvest study which Stephen Skelton produces each year comparing sugar levels in grape varieties grown at different altitudes. There is a clear trend for higher sugar levels on vineyards at 60m or less, compared to those above 100m. Grange Farm falls from approximately 60m down to 20m, which is in the ideal range.
We select for slopes facing between southeast through to southwest, due to even sun exposure that the vines receive during the day. As you can see from the contours in the map above, the slope at Grange Farm mainly falls due south, except for a slight cross slope in the southeastern corner of the farm where the contours bend upwards. This represents a slight bowl in the landscape, which wasn’t planted on account of the potential for it to collect frost. The rest of the slope is ideal for vine production.
The funny thing about the north bank of the River Crouch is that the slope is very undulating. You can see that from the way that the contours wave about. There is also a mixture of gradients, which you can see from the variety in how close together the OS contour lines are – ideally you want an even gradient of between 4 – 9 degrees. Any steeper and it’s dangerous to turn a tractor and any shallower and the site gets less sun exposure, and the frost does not run down the slope as quickly.
The table below shows the site suitability characteristics of Grange Farm relative to the thresholds that Knight Frank sets for good vineyard sites.
|
|
Grange Farm |
Knight Frank Threshold |
|
Growing Season Temperature |
14.9 deg C |
>14.0 deg C |
|
Growing Season Precipitation |
332 mm |
< 420 mm |
|
Elevation |
60m - 20m |
<100m |
|
Slope Orientation |
South |
South East – South West |
|
Frost |
25 |
< 40 days |
As you can see, the statistics of Grange Farm outperform every one of the Knight Frank thresholds. Sometimes in an industry, there are events which change the narrative. Champagne Taittinger and Hatch Mansfield’s acquisition of a fruit farm in Chilham in 2015 under the brand of Domaine Evremond to make premium sparkling wine in England was such a moment. Jackson Family Wine’s purchase of Grange Farm to make premium still wine was another such moment. Both are pertinent to me as I am fortunate to have been involved in both transactions.