Global City Economic Watch Tuesday 9th June
As large-scale quarantine measures begin to be lifted globally, we are providing a weekly glance at different real-time indicators to assess the level of economic activity in cities and understand how much closer to ‘normality’ they are.
3 minutes to read
Populations are increasingly returning to their daily lives as more outlets, schools and offices begin opening. Last week Singapore began lifting measures after an eight-week circuit breaker and yesterday Jacinda Ardern lifted New Zealand’s lockdown after declaring no known active cases in the country.
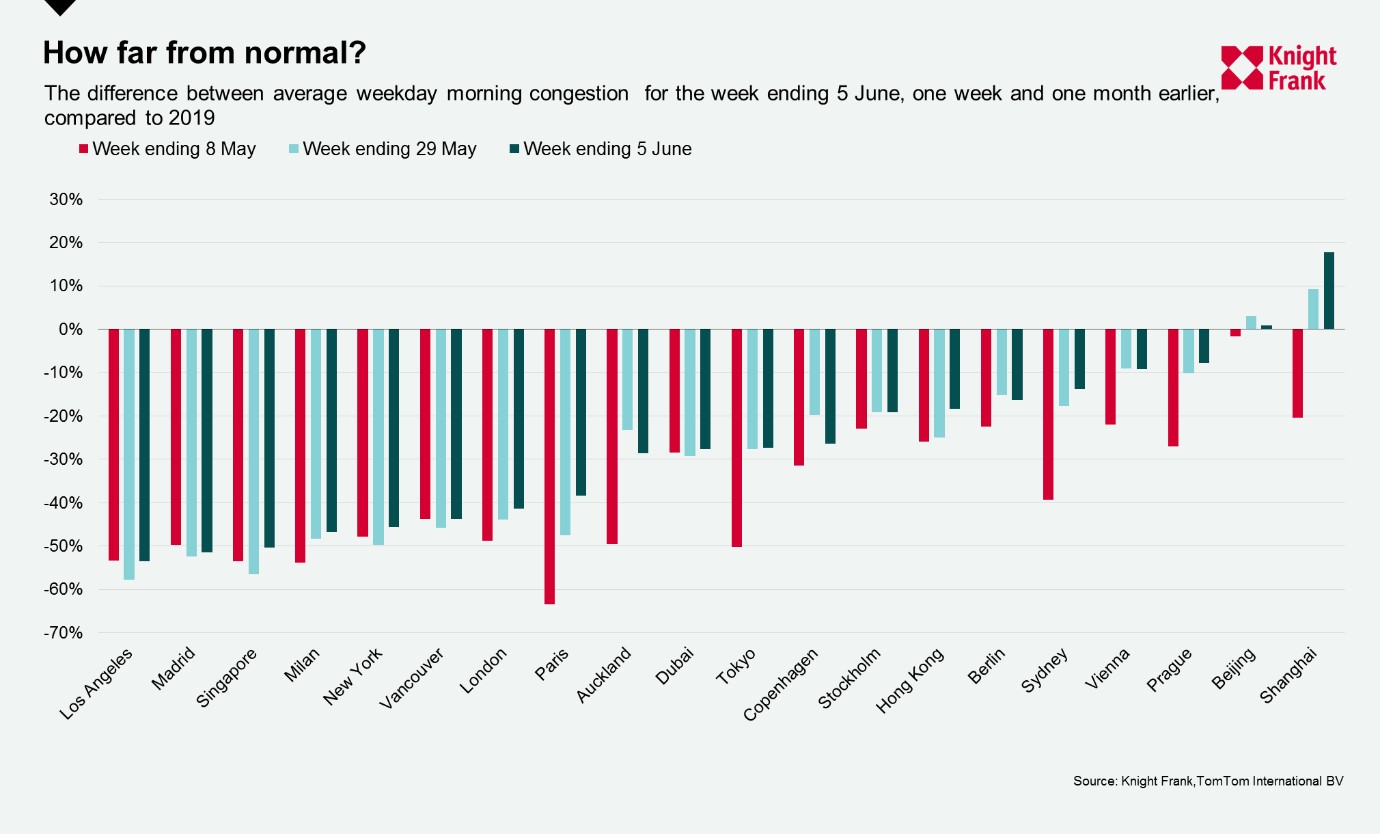
According to TomTom** seven of the 20 cities we track saw double-digit movements in average morning congestion levels over the past month – Shanghai, Sydney, Paris, Tokyo and Auckland all saw more than a 20% increase.
Shanghai and Beijing both remain busier than their 2019 averages, Shanghai by 18% last week with an average morning congestion of 77%. As Australia continues to lift more restrictions, Sydney now sits only 14% below its 2019 average of 63%. Singapore is still among those cities furthest from ‘normal’ by this measure, but as restrictions begin to lift we expect to see an uptick, the city has already gone from an average congestion of 0% two weeks ago to 6% last week.
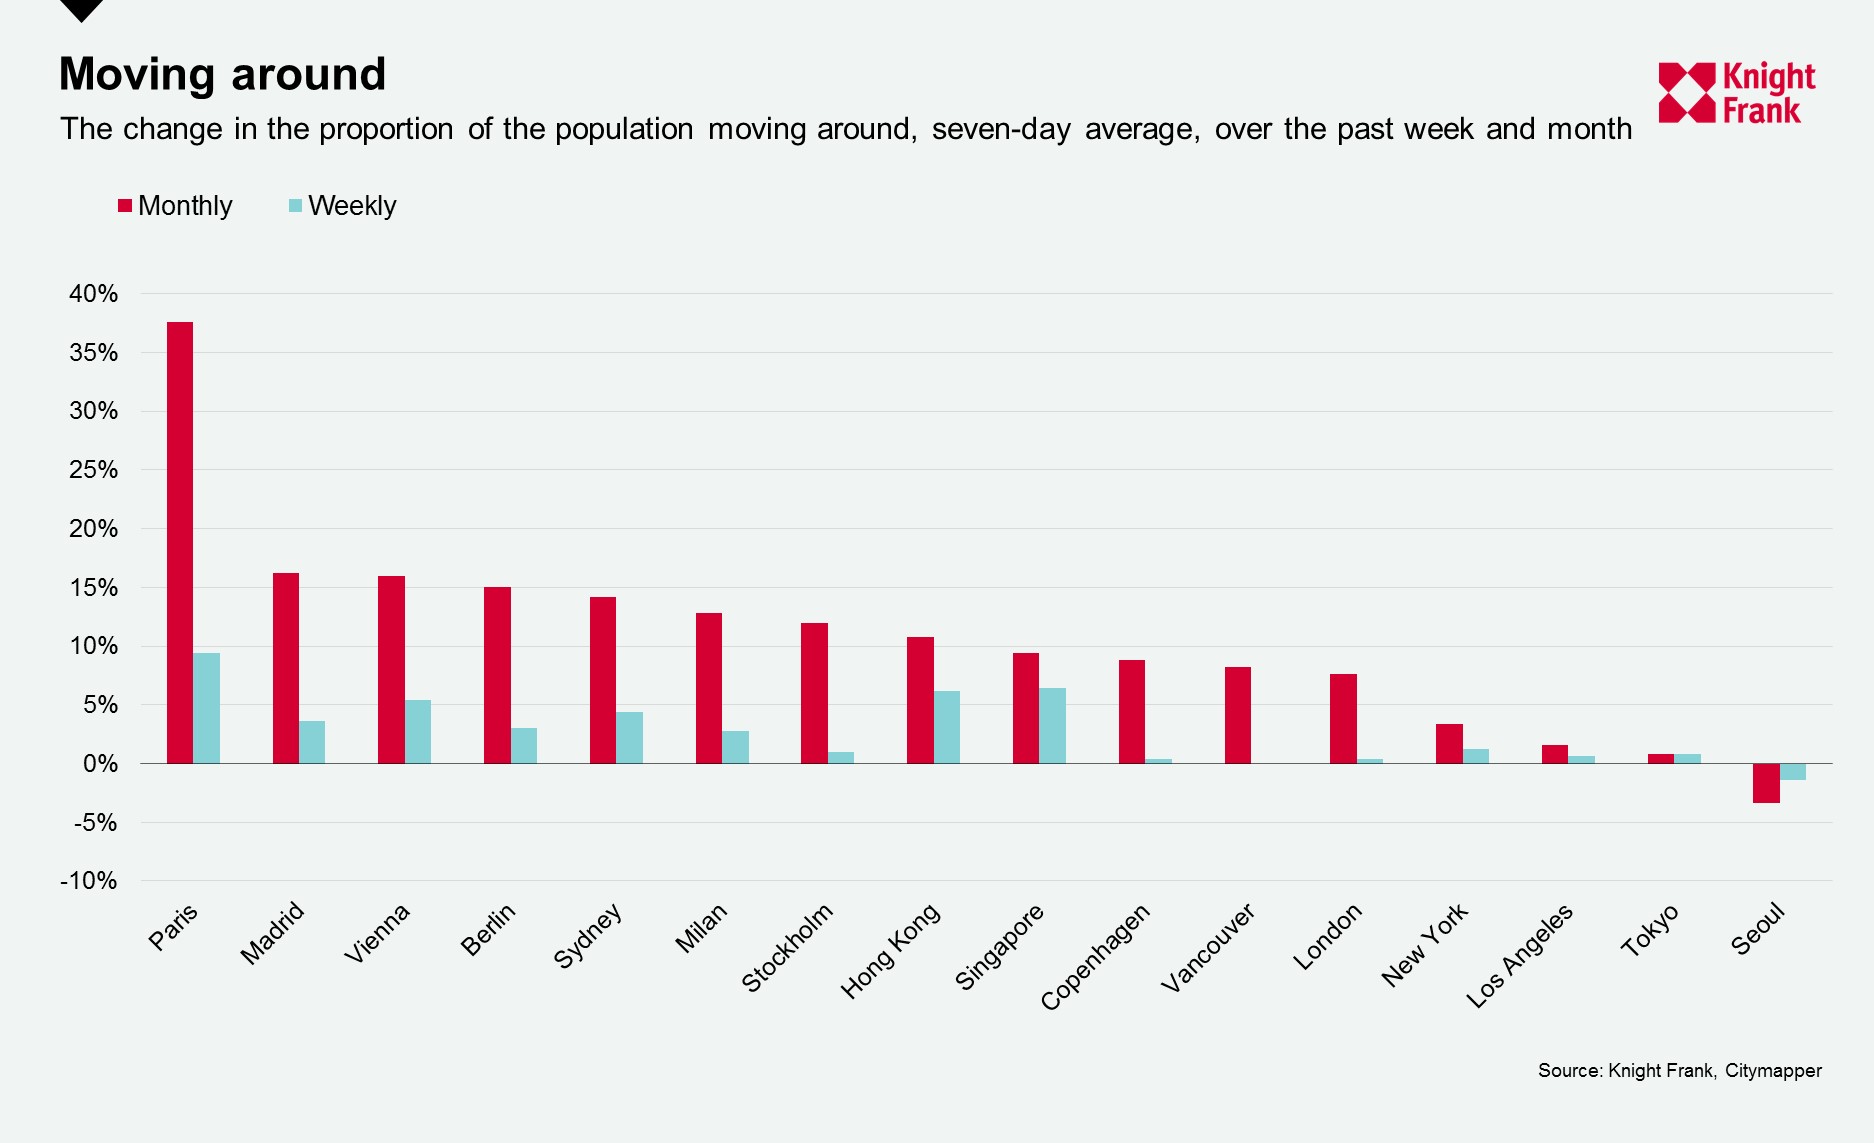
Looking at a broader measure of population mobility, the Citymapper Mobility Index*, which looks at population mobility compared to usual, there were bigger changes with all except Seoul seeing an increase over the past week and month.
Paris, with 45% of the population now mobile compared to normal, once again leads with the biggest uptick, an increase of 9% from one week ago – it was the second most mobile out of the cities we tracked last week. Singapore and Hong Kong both saw their mobility rise by 6% to 22% and 60% respectively.
Tokyo, New York and Los Angeles are the least mobile cities, at 8%, 10% and 12% respectively – and all saw a rise of just 1% over the past week.
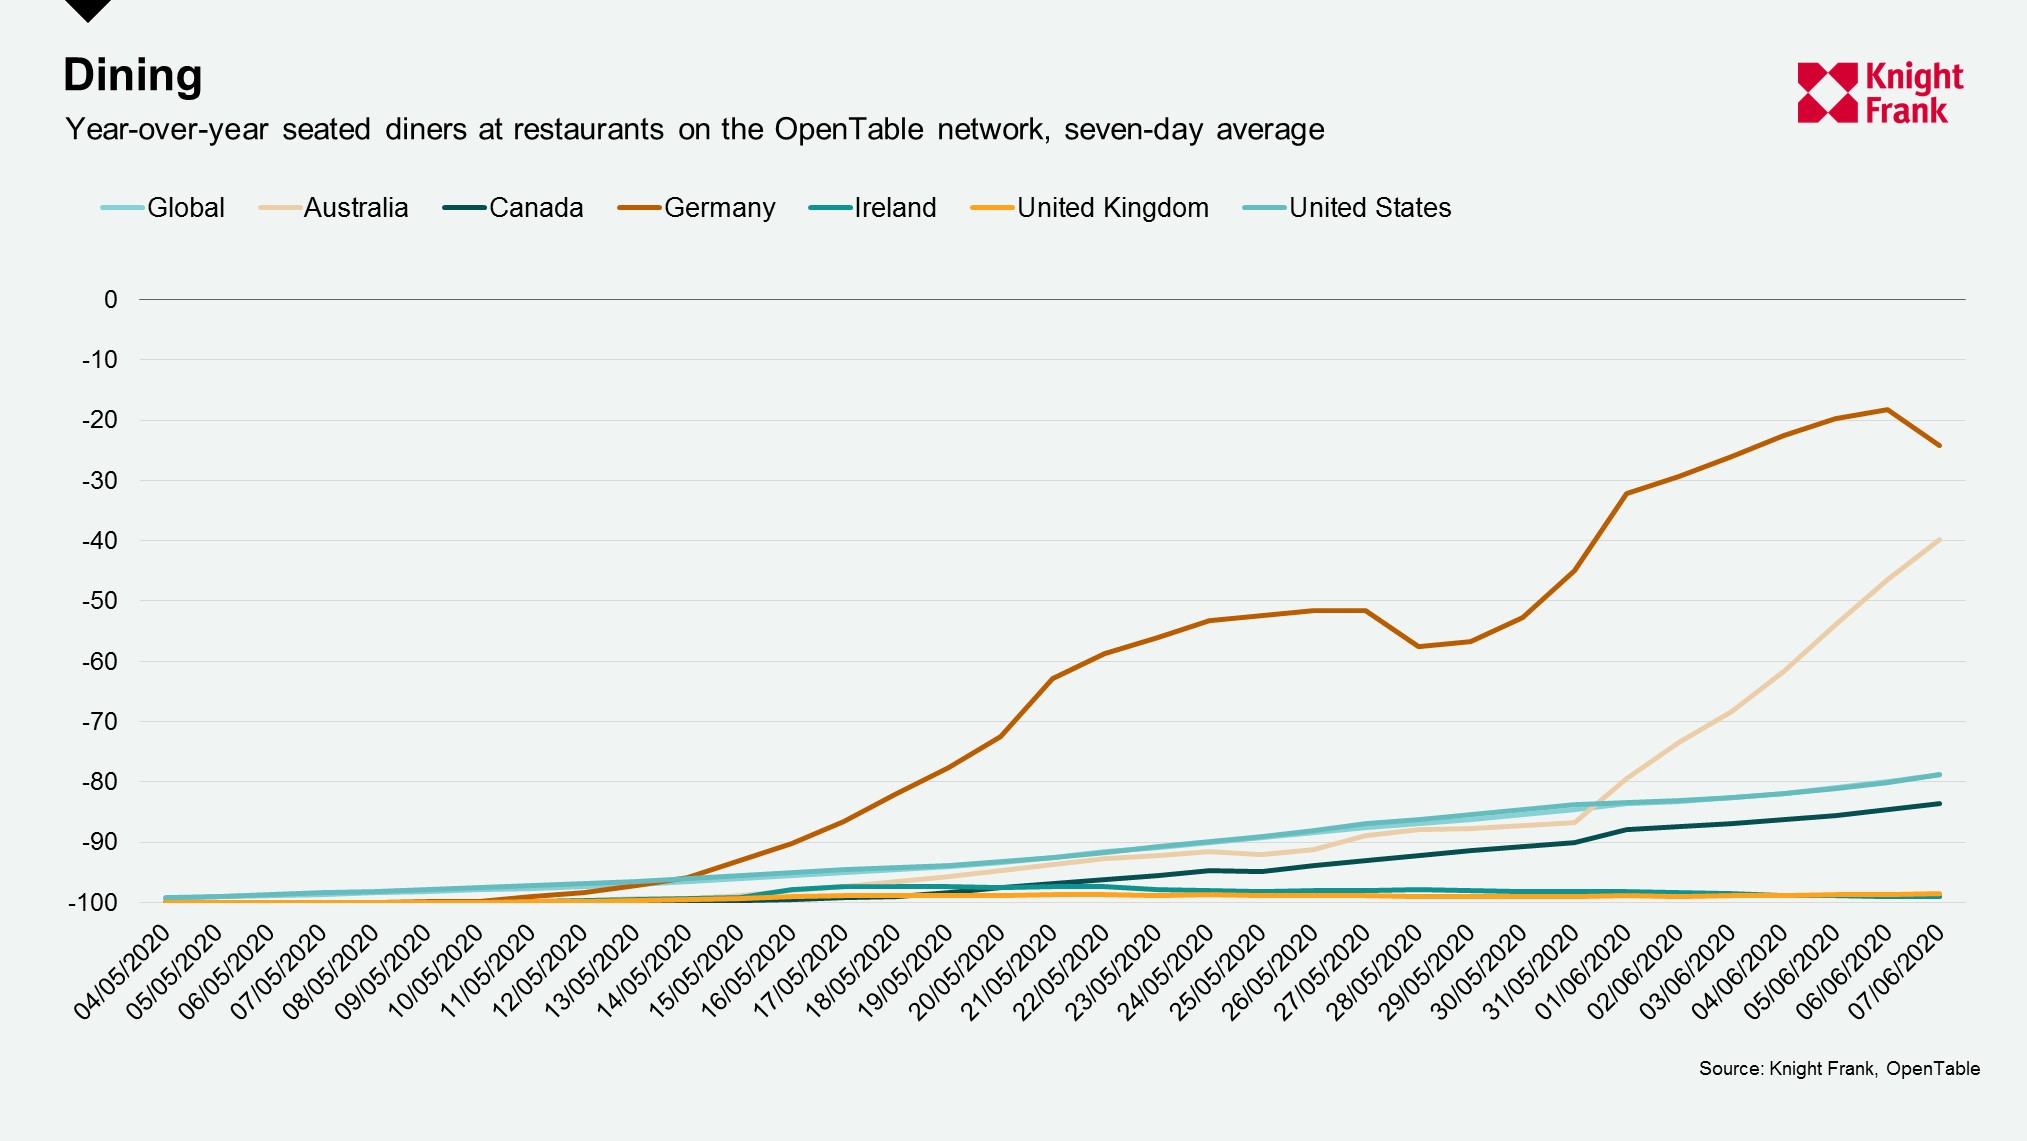
As more cities begin to allow restaurants to open their doors for dine-in customers, there has been an uptick in restaurant bookings tracked by OpenTable data – the year-on-year change globally now sits at a decrease of 79% compared to 100% at the beginning of May.
Whilst Germany is closest to last year’s average, with a 24% decrease on average over the seven-days to 7 June, Australia has seen a sharp rise as more restrictions have been lifted – going from a decline of 87% year-on-year a week ago, to just 40%. In the cities tracked many restaurants remain closed, but some in US, such as Miami and Dallas are seeing improvements, sitting 74% and 72% respectively below last year’s reservation numbers.
Next week we will check in on different indicators from the Google’s COVID-19 Community Mobility Report and the level of flight activity from FlightRadar24. We will also continue to monitor other high frequency indicators such as box office takings as these establishments start to reopen.
Notes on methodology
*The Citymapper Mobility Index looks at the percentage of the population moving compared to a recent typical usage period, they do this by comparing trips planned in the Citymapper app to a recent typical usage period as trips planned are correlated to trips taken.
**The congestion level looks at how much longer a trip would take compared to baseline, e.g. a level of 53% means that a 30-minute trip will take 53% more time than it would during baseline uncongested conditions.