Global City Economic Watch Tuesday 19th May
As large-scale quarantine measures limit the movement of urban populations globally, we are providing a weekly glance at real-time indicators to assess the level of slowdown in economic activity and how quickly cities are beginning to return to normal.
2 minutes to read
In this week’s edition we look at different indicators within Google’s COVID-19 Community Mobility Report* on a city-by-city basis and provide an update on the latest flight activity.
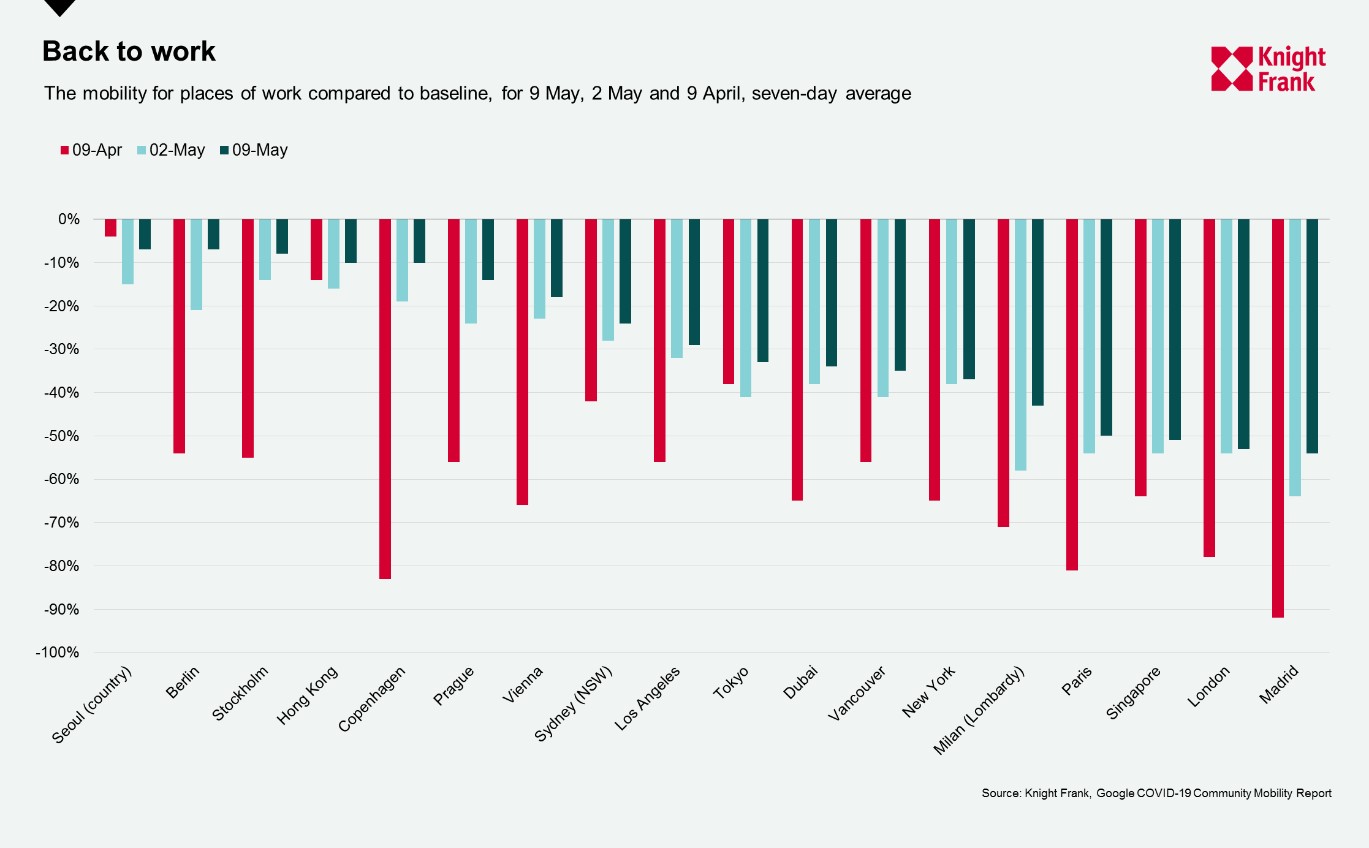
Google’s COVID-19 Community Mobility Report analyses how visits and the time spent at different places have changed compared to a baseline. Here we look at how the mobility for places of work have changed for the week ending 9 May compared to a week and month earlier.
All of the 18 locations we’re tracking saw an increase in visits and time spent at places of work during the week ending 9 May compared to a week earlier, with 15 of the 18 cities recording double digit increases over the past month.
The biggest step change has been in those cities where restrictions have loosened, such as in Milan (the Lombardy region), Berlin, Prague and Madrid, these cities have moved to 43%, 7%, 14% and 54% below their baseline, although some still have some way to recover.
Five of our cities are within 10% of their baseline with Seoul joining Berlin at 7% below, Stockholm at 8% below and both Hong Kong and Copenhagen 10% below. Madrid at 54% below is still the furthest from ‘normality’, yet this is a marked improvement from -92% one month ago. London sits second lowest at -53%, but with some restrictions being loosened from 13 May this will likely move towards baseline with the next data release.
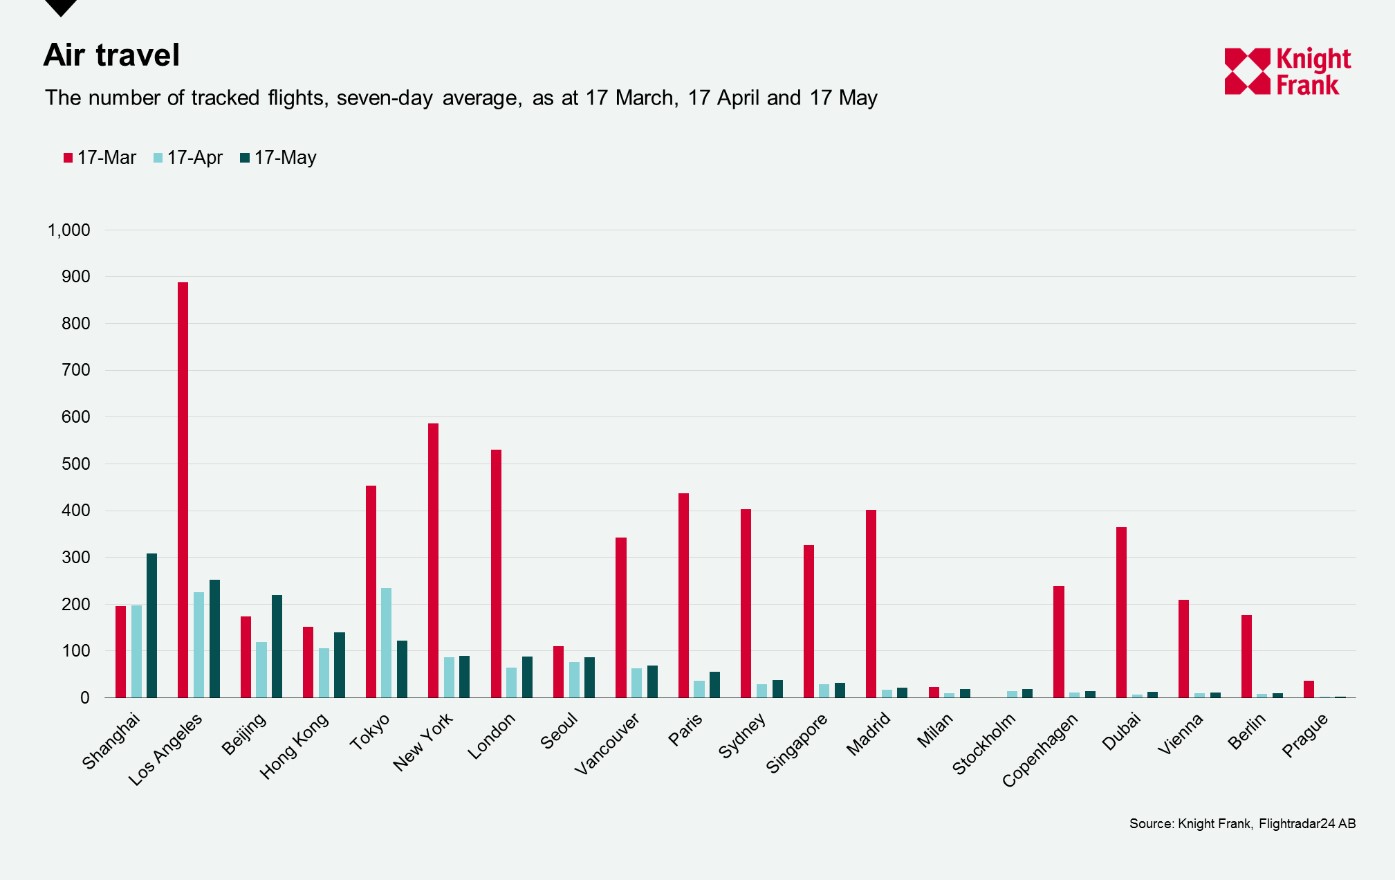
Below we look at how the lockdown measures and travel restrictions have impacted air travel over the past two months. By assessing the seven-day average number of departures on 17 March, April and May we can seen that there was a sharp drop between March in April in most of the locations we look at, with the exception of Beijing and Shanghai which were already experiencing restrictions.
In 19 of the 20 location there has been an increase in activity from 17 April to 17 May, the exception being Tokyo where the average has fallen by over 100 departures. As my colleague Kate Everett-Allen sets out a number of airlines have been operating skeleton schedules in recent weeks, however many estimate that it will be 2022 or 2023 before flight traffic returns to pre-pandemic levels.
Hong Kong saw the largest increase in flight departures with an additional 21 a day on average over the past week, this is followed by Beijing and Shanghai, both with an additional 13, and Paris with an additional 11.
Next week we revisit population mobility through the Citymapper Mobility Index and TomTom Traffic Index as well as the level of restaurant bookings as economies begin to emerge from lockdown and restaurants offer limited seated capacity.
Notes on methodology
*Google’s COVID-19 Community Mobility Report analyses the how visits and time spent at different places change compared to a baseline. The baseline is the median value, for the corresponding day of the week, during the 5- week period Jan 3–Feb 6, 2020