Global City Economic Watch - 12th May
As large-scale quarantine measures limit the movement of urban populations globally, we are providing a weekly glance at real-time indicators to assess the level of slowdown in economic activity and how quickly cities are beginning to return to normal.
3 minutes to read
In this week’s edition we look at how each city is moving by checking in on traffic congestion and population mobility – particularly in those which have started to ease some restrictions and restart business operations.
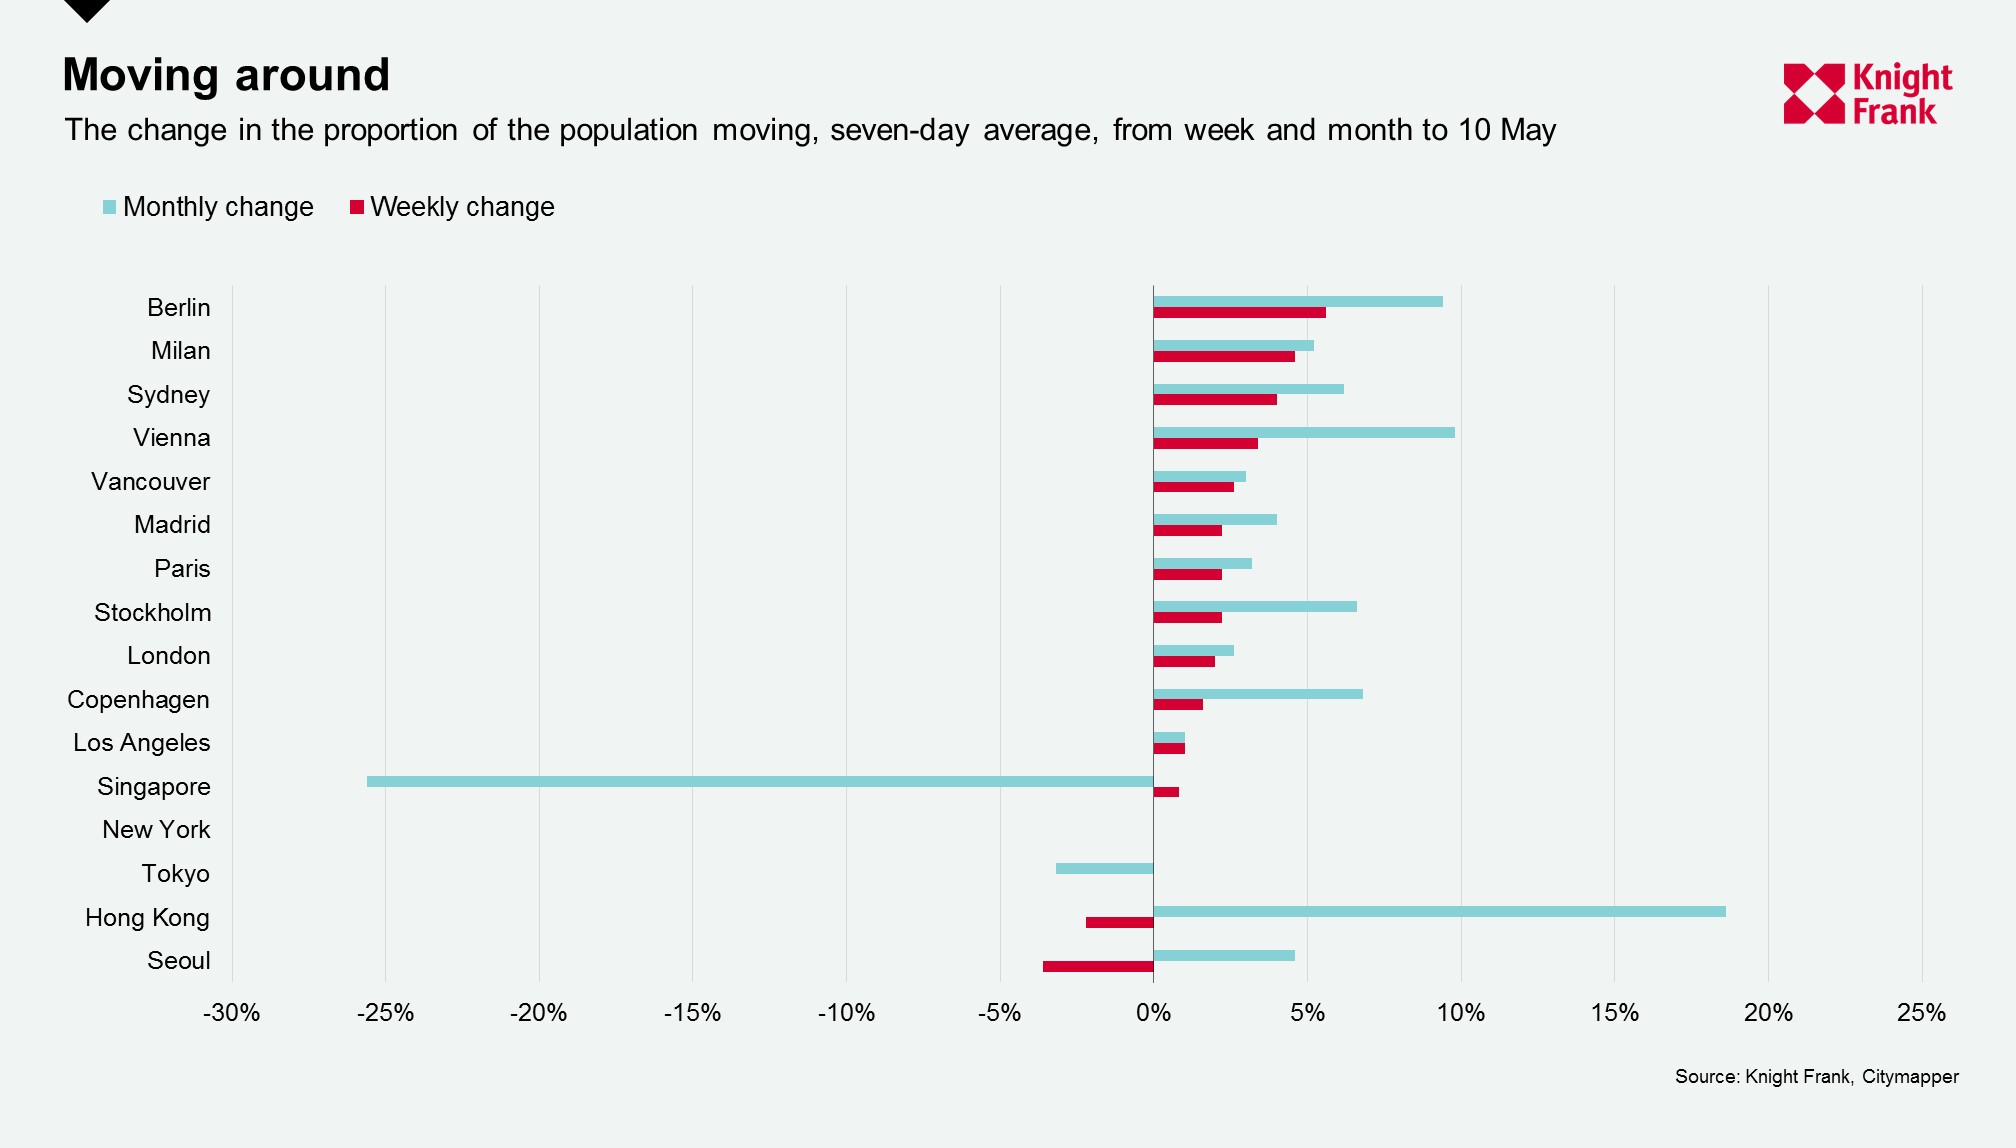
The Citymapper Mobility Index* which looks at the proportion of the population moving compared to usual shows an uptick in movement for three-quarters of our cities over the past week and month.
The weekly increase was led by Berlin, Milan and Sydney who saw their proportions rise to 22%, 8% and 20% respectively – a growth of 6%, 5% and 4% on their respective seven-day averages. Australia has unveiled a three-stage plan to progressively lift restrictions by July with each state and territory determining its own timetable, New South Wales is looking to ease some rules on Friday.
This week marks an easing across European locations with Spain reopening outside areas in restaurants, except for in Madrid and Barcelona, and France lifting the need for permits to leave home and allowing businesses to reopen if distance can be maintained. However, with some localised outbreaks in South Korea leading to a tightening of revisions we have seen Seoul’s mobility drop by 4% to 41% in the past week, yet it still remains around 5% higher than one month ago.
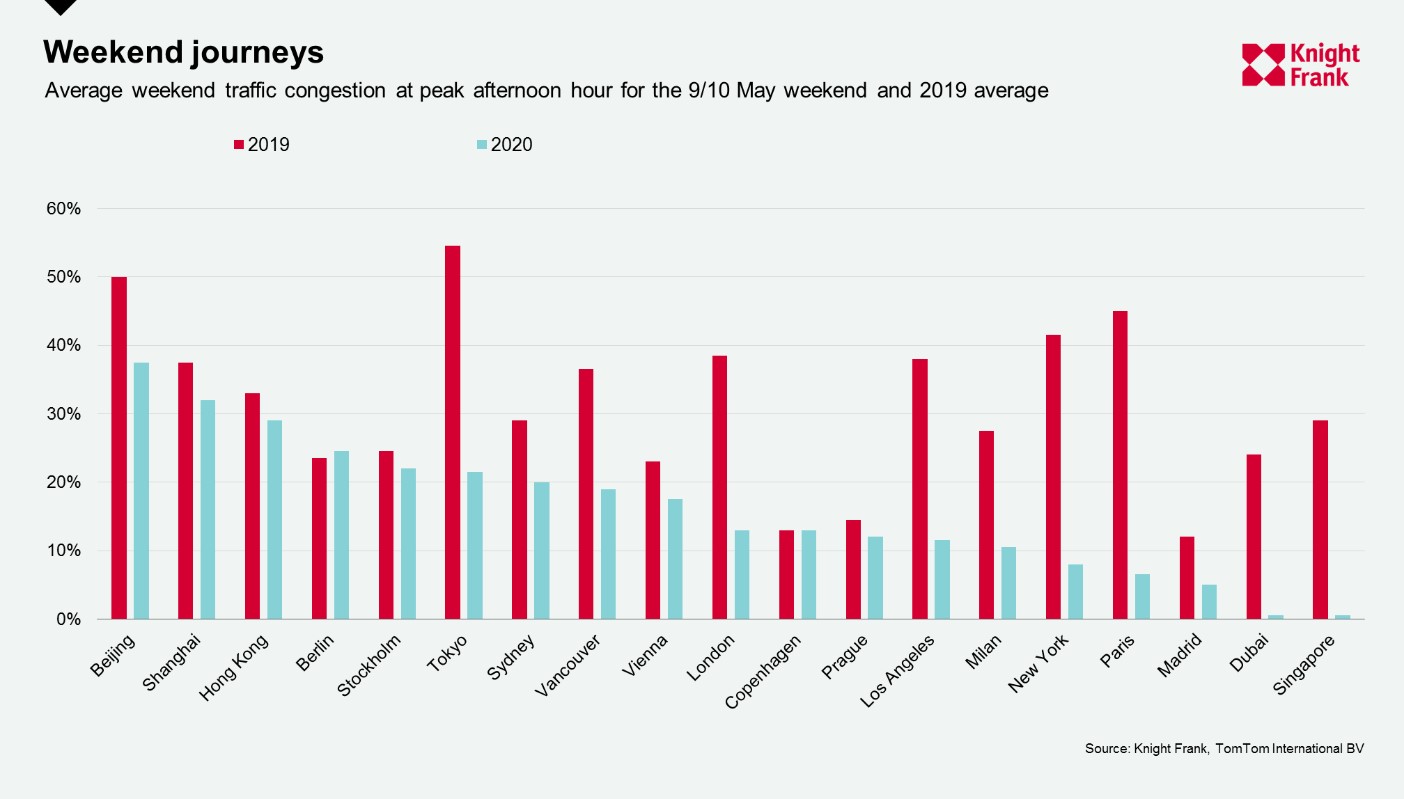
Given the varying national holidays in many locations last week we focused in this edition on the weekend traffic. According to TomTom**, Berlin and Copenhagen are the only two cities at or marginally above their 2019 averages. The cities furthest from weekend normality are Paris, New York and Tokyo, sitting 39%, 34% and 33% below their respective 2019 averages. However, when we look at this weekend compared to a week earlier there has been an uptick in all cities except London, where congestion was 1% lower.
Using OpenTable data we are monitoring restaurant bookings in different cities and countries. Whilst many restaurants remain closed, or for delivery only, a few have begun to operate with capacity constraints. Across the United States, the number of seated diners at restaurants has shifted marginally from -100% a month ago to -97% suggesting a slight change in dining practices. Whilst restaurants remain at -100% in New York and Los Angeles some other cities where states have relaxed restrictions, such as in Dallas have seen the year-on-year decline recede to -87% on 9 May from -91% a week earlier.
Germany’s restaurants have also gone from -100% a week ago to -99% on 9 May – whether this continue will depend on whether restrictions are reinforced given the rise in the all-important R indicator.
Next week we will check in on different indicators from the Google’s COVID-19 Community Mobility Report and the level of flight activity from FlightRadar24. We will also continue to monitor OpenTable and other high frequency indicators such as box office takings when these establishments start to reopen.
Notes on methodology
*The Citymapper Mobility Index looks at the percentage of the population moving compared to a recent typical usage period, they do this by comparing trips planned in the Citymapper app to a recent typical usage period as trips planned are correlated to trips taken.
**The congestion level looks at how much longer a trip would take compared to baseline, e.g. a level of 53% means that a 30-minute trip will take 53% more time than it would during baseline uncongested conditions.