Global City Economic Watch Wednesday 27th May
As large-scale quarantine measures begin to be lifted globally, we are providing a weekly glance at different real-time indicators to assess the level of economic activity in cities and understand how much closer to ‘normality’ they are.
3 minutes to read
Populations are once more becoming more mobile and car use is rising in a sign that people in cities around the world are gradually beginning to return to their daily lives.
All 16 of the locations we monitor reported an increase in movement over the past week and month, the first time this has been the case since we started tracking data on traffic congestion and population mobility eight weeks ago.
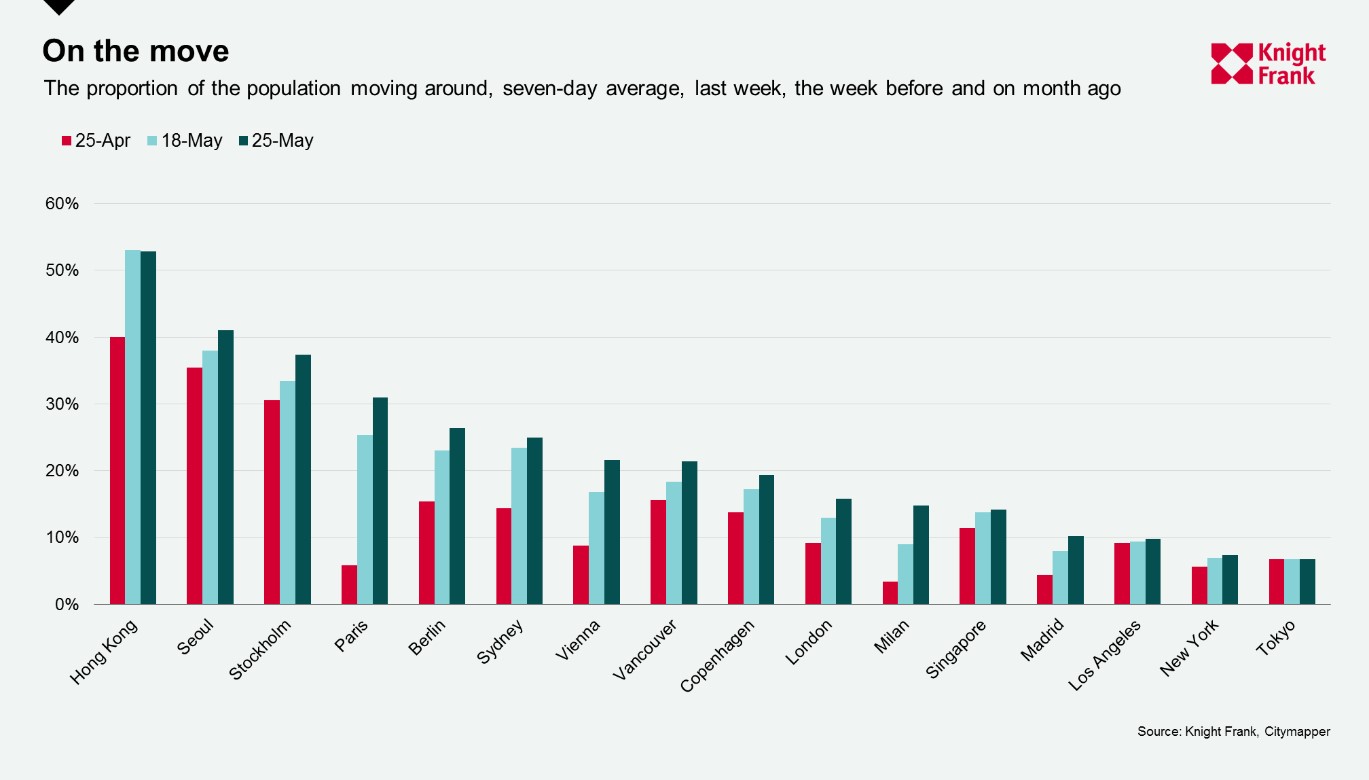
According to the Citymapper Mobility Index*, which looks at the proportion of the population moving compared to usual, the average proportion of citizens moving across these cities stands at 22%, compared to 20% a week ago and 14% one month ago.
Unsurprisingly, given lockdown restrictions were eased earlier or less stringent than in other cities, the populations of Hong Kong, Seoul and Stockholm remain the most mobile with 53%, 41% and 37% of the population on the move respectively but there have been marked increases in several locations.
Paris led the way, with mobility rising to 31%, up from 6% one month previously. Vienna, which was the seventh most mobile city tracked, has seen mobility rise by 5% in the past week to 22%.
Tokyo, was the least mobile city, at 7%. However, we expect this will rise in the coming weeks as the state of emergency was lifted on Monday, effectively ending the country's soft lockdown.
Complementing the more mobile population from Citymapper’s index we have also seen traffic congestion in many of our 19 cities inching closer to their 2019 averages. According to TomTom**, both Shanghai and Beijing remain above their 2019 average. As China was the first to ease restrictions, this could suggest the prospect of a strong resurgence in activity for other economies as they move further from pandemic levels.
Vienna and Prague are within 20% of their 2019 levels with congestion averaging 28% and 38% respectively for the week ending 22 May. Paris, Los Angeles and Singapore sit furthers away, with these cities experiencing 57, 55 and 55 percentage points less congestion, respectively, over the past week compared to their 2019 averages,
As restaurants begin to open their doors for dine-in customers, there has been an uptick in restaurant bookings tracked by OpenTable data.
Across the United States, the number of seated diners at restaurants has shifted marginally from -100% a month ago to 90% below last year’s level over the most recent seven-day period. The change can be seen within cities with New York experiencing a drop in restaurant bookings of 99% compared to a year ago, Miami at 96% below and in Dallas, where restrictions were lifted earlier, the year-on-year decline fell to 77% lower from 86% a week earlier.
Germany is seeing the quickest bounce with the year-on-year decline in seated diners rising from 100% below last year’s level a month ago to just 53% below in the week to 24 May.
Next week we will check in on different indicators from the Google’s COVID-19 Community Mobility Report and the level of flight activity from FlightRadar24. We will also continue to monitor other high frequency indicators such as box office takings as these establishments start to reopen.
Notes on methodology
*The Citymapper Mobility Index looks at the percentage of the population moving compared to a recent typical usage period, they do this by comparing trips planned in the Citymapper app to a recent typical usage period as trips planned are correlated to trips taken.
**The congestion level looks at how much longer a trip would take compared to baseline, e.g. a level of 53% means that a 30-minute trip will take 53% more time than it would during baseline uncongested conditions.