What and why with EUI
Accurate energy data is rapidly becoming an asset in its own right, a trend highlighted in our 2025 ESG Outlook and reinforced by our 2025 ESG Property Investor Survey. EUI is now a leading metric for investors, with nearly 50% of survey respondents requiring whole-building energy data before acquisition. This demand is driven by tools such as CRREM, which help identify transition risks and assess regulatory alignment.
In the UK, reliance on Energy Performance Certificates (EPCs) persists, as they remain the only industry-wide, comparable metric due to regulation. However, EPCs have been criticised for failing to reflect actual energy performance. While reforms are underway following the consultation at the end of 2024, there is growing recognition that theoretical performance must be complemented by real-world data due to difference in users. Indeed, the previous government consulted on Introducing a performance-based policy framework in large commercial and industrial buildings to address this aspect, the response has yet to be published. Both are needed for a complete picture of building efficiency and are best utilised combining with other key metrics to fully understand and enhance the sustainability of each asset and provide a metric for valuation.
“For a number of years valuers have been asked to establish causation when it comes to sustainable investment, isolating and thereby quantifying a so called “green premium”. Yet, we are unable to do so with ESG factors beholden to a large degree of subjectivity, meaning they are not assessed, measured and ultimately priced uniformly.” Notes Anna Emmison, ESG lead for Knight Frank Valuation & Advisory. “ESG-related factors cannot be assessed in a comparing “apples with apples” way as is possible with other risk factors such as lease length which can be compared against lease length, or covenant against covenant, for example. EUI is a very important step forward because in theory it provides that single comparable data point.”
Consistency is key
As EUI becomes the go-to metric for actual performance, it is important to ensure consistency in measurement as variations remain a barrier to accurate pricing of ESG risks. The 2025 Emerging Trends in Real Estate Europe survey found that three-quarters of respondents believe current valuations do not reflect challenges such as climate change and occupier demand. Similarly, 77% agree that ESG credentials will materially affect asset values in the next 12-18 months.
The Institutional Investors Group on Climate Change (IIGCC) aims to address this through the Aligning Real Estate Sustainability Indicators (ARESI) White Paper, which seeks to standardise metrics and methods, increasing transparency and consistency. EUI is highlighted as a standalone KPI and as an element of several others. The paper highlights the ambiguity with this one measure able to produce 16 combinations, depending on variables such as gross versus net and final versus primary demand. That is before area (Gross Internal Area (GIA), Net lettable Area (NLA) etc.) and data collection methods are factored in. The recommended approach is to use GIA and Gross Measured Primary Energy, excluding Transition Enabling energy use, to better track year-on-year improvements.
Fig 1: EUI variants
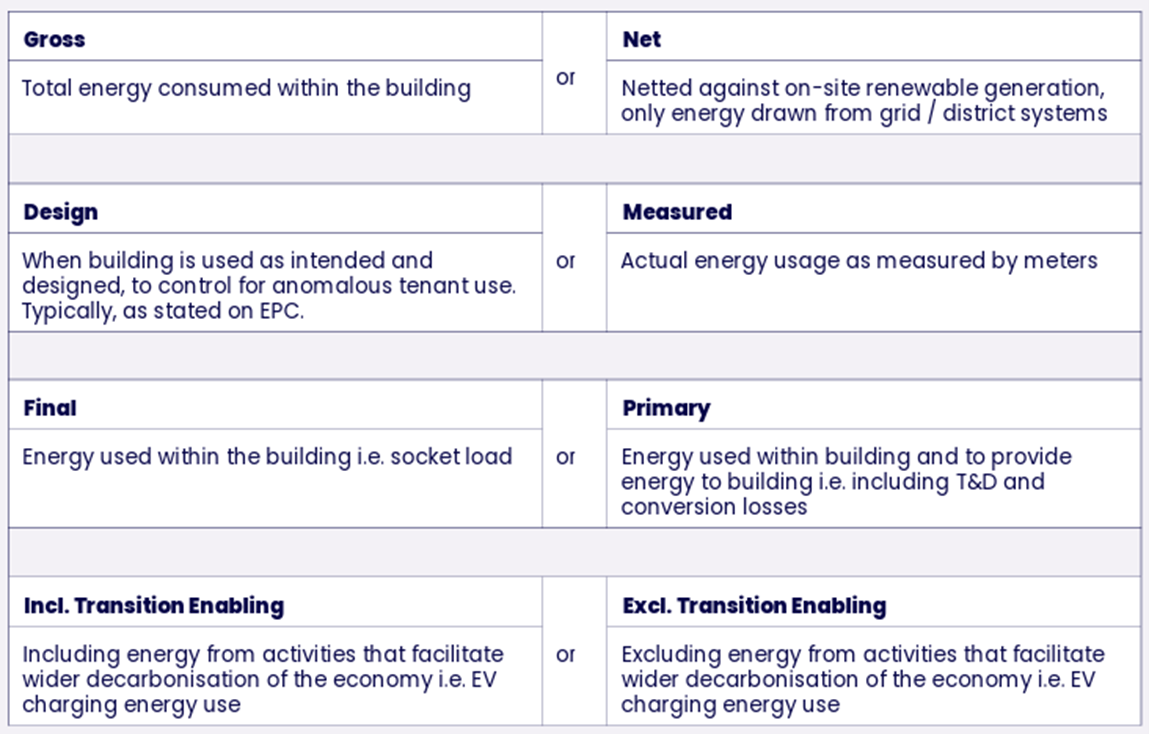
Source: IIGCC ARESI White Paper
Applications and benchmarks
Beyond measurement, knowing what constitutes a ‘good’ EUI is crucial for valuation. The Real Estate Environmental Benchmark (REEB) is one of the industry’s most widely cited guidelines, based on annual consumption data from BBP members. The 2024 edition provides ‘typical practice’ (50th percentile) and ‘good practice’ (25th percentile) benchmarks, some examples are shown in Table 1 below.
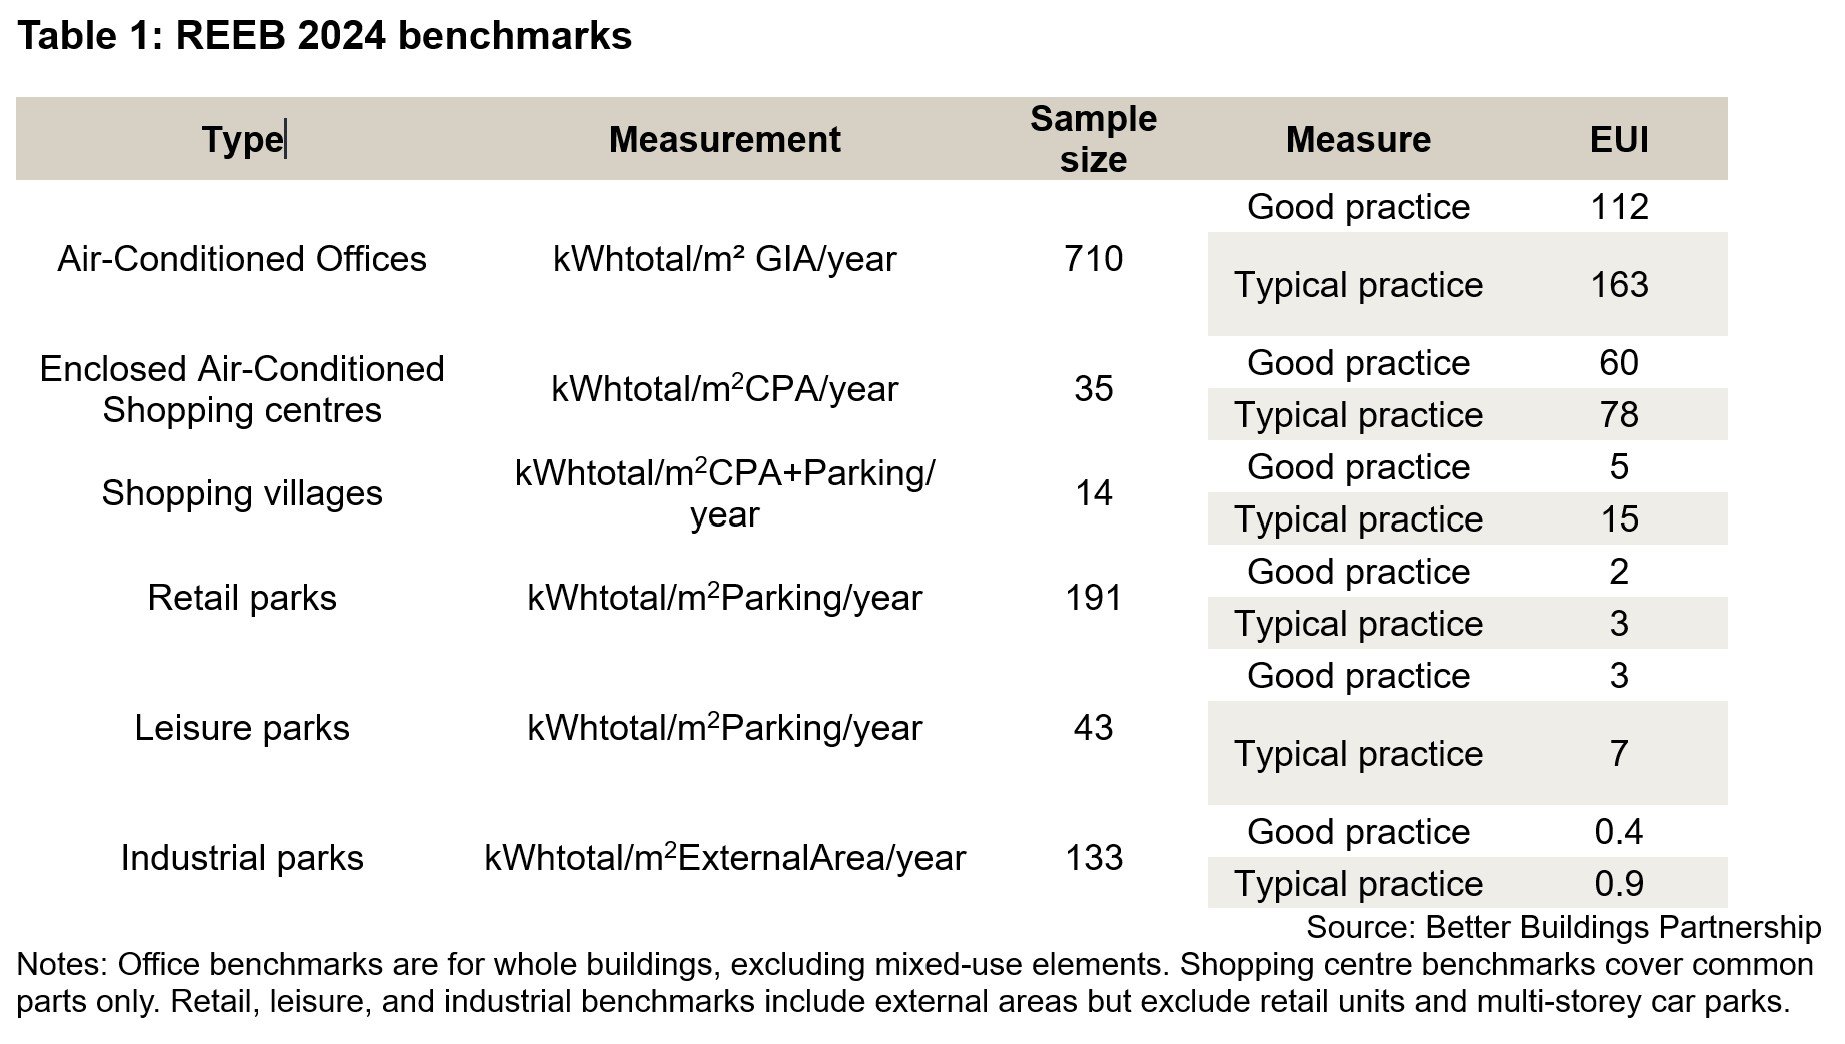
A KPMG study of EPRA non-financial from 103 European listed real estate companies provides further insight. For EU Taxonomy compliance, a building must be in the top 15% (or EPC A). Table 2 summarises what that looks like across offices, retail, and industrial assets (the average and top 15%). Comparing REEB and KPMG’s findings on EPRA, offices have a similar average (163 vs 164 kWh/m²/year), but there is a clear gap between ‘good’ (25th percentile) and top 15% (112 vs 77 kWh/m²/year).
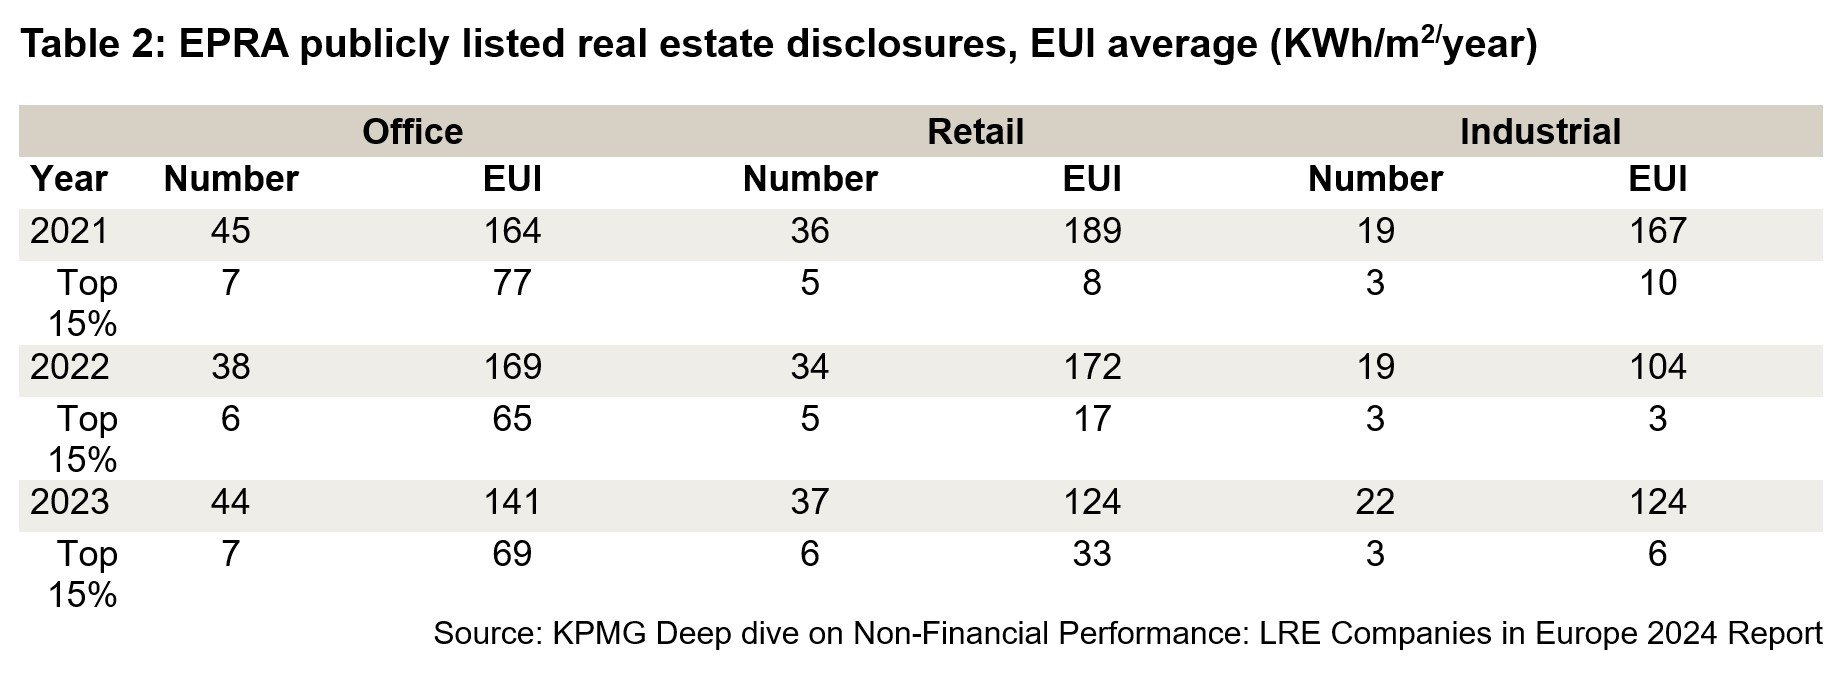
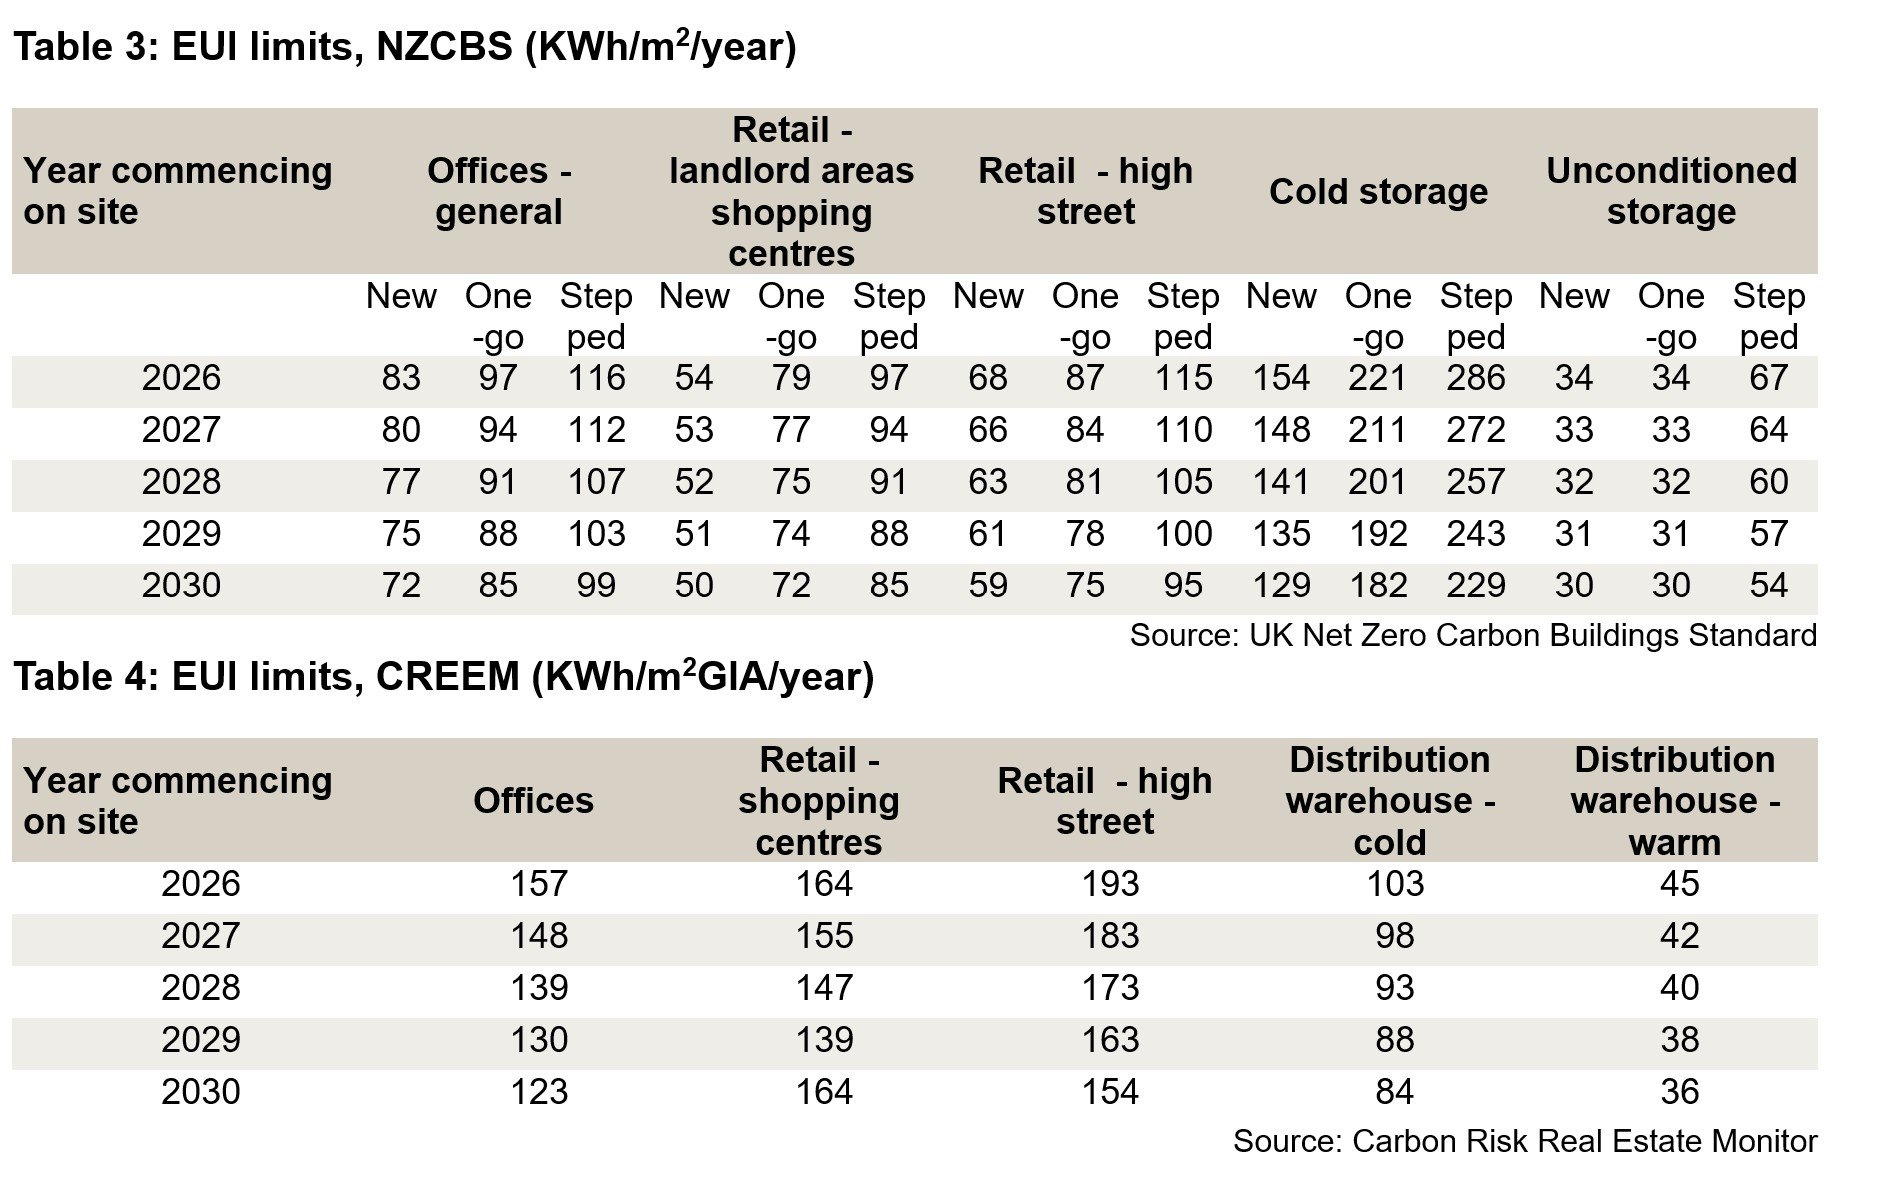
Remarkably both sit high above recommended targets for net-zero alignment. The UK Green Building Council (UKGBC) recommends a Paris-proof target for offices of 55 kWh/m²/year, with interim targets of 90 kWh/m²/year for 2025–30. The Net Zero Carbon Building Standards Pilot Version sets annual limits by asset type and year of retrofit commencing (see Table 3 for examples). Perhaps a better benchmark for standing assets, and how far they are from aligning to transition to net zero is the Carbon Risk Real Estate Monitor (CREEM) pathway which sets intensity targets by asset type and year (see Table 4), yet the sector breakdown is more limited.
These variances and the EPRA study clearly highlight the inconsistencies and confusion over aims and application to specific assets. Both benchmarks and companies use varied approaches and denominators, making comparison difficult. Our review of reports from a number of UK REITs found that the majority report EUI, but with wide variation - some at portfolio level, some at asset type or geography, and some including tenant usage while others focus on landlord-controlled only.
Yet, despite methodological differences, the presence of the metric itself could go somewhere to help ESG integration in valuation. “Whilst we acknowledge there are still inconsistencies in how EUI is reported, it is a metric with actual, operational, financial and reputational impact and one likely to drive decision making,” adds Anna. “EUI directly reduces operating costs, enhancing profitability and net income; can have implications for tenant attraction and retention, especially those seeking to reduce their own operational expenses and align with sustainability goals; and finally, aligns with broader market demand for sustainable and energy-efficient buildings.”
While we have come a long way, and fast, in data collection and reporting, this further cements the need for greater data sharing and standardisation, and importantly verification, to enhance visibility and allow for ESG to be priced in more consistently.
You can’t manage what you don’t measure
The adage ‘you can't manage what you don’t measure’ underpins ESG disclosure. While progress has been made, many are still early in their journey. For future-proofing, understanding EUI, its role in achieving targets, and optimising it is essential.
Corporate targets must be translated into asset-level action. The first step is establishing a baseline: what data is needed, what is available, how reliable is it, and how can it be improved? These baseline energy audits, critically with regular reporting, are key to understanding the energy usage patterns to correctly measure consumption before any asset-level action plans are created and costly measures are taken. For asset-owners there lies an additional complexity: not only collecting your own data, but obtaining that of your tenants. Looking at the sample of UK REIT’s reports, the level of tenant data coverage ranges from around a quarter to almost 90%. More broadly, from the GRESB 2024 data we can see that energy data coverage was 75%. Tenant engagement and shared understanding is critical to closing this gap and it is now common to have a ‘green’ lease clause regarding data sharing, although implementation varies.
Management and improvement
Once you understand the starting point, how to optimise performance will depend on several factors, for example existing equipment type and age, building layout and size, and lease arrangements. The EPRA report notes that companies are improving energy efficiency through measures such as installing renewables, upgrading HVAC systems, and enhancing insulation. This is noted by our research on REITs where they report KPIs on solar capacity, proportion of renewable electricity, and electrification to improve efficiency and EPC ratings.
We point to many of these interventions in our Meeting the Commercial Retrofit Series. “The key to any intervention is the timing of capital expenditure (capex) improvement works ensuring interventions are staged optimally for cost and EUI improvements” notes Joe Warren, Head of Technical Energy and Carbon Services. “This requires identification and alignment based on building and plant age, lease terms and wider market conditions. However, as an initial priority, management and smart controls can accurately match occupant demand and occupancy rates, resulting in notable EUI reductions with minimal capex expenditure. These smaller-scale interventions can better align buildings to their expected EUI rates before undertaking deeper retrofitting measures on optimal pathways.”
Practical applications
“There is no one size fits all,” Claire Murray Interim ESG Lead for Property Asset Management at Knight Frank notes. “Each asset and portfolio approach needs to be unique. We have been helping clients to operationalise sustainability action plans through a focus on occupier behaviour change, and energy efficiency optimisation. Whether that includes: enhancing data accuracy and granularity through meter verification surveys, sub-metering, and automation of data collection through BMS and centralised data platforms; implementing ‘quick wins’ such as LED lighting upgrades, smart controls; and time scheduling of plant & equipment; through to larger scale project works such as electrification and boiler replacement projects.”
To assess improvement, we analysed a sample of operational gas and electricity data across Knight Frank’s Property Asset Management (PAM) portfolio from 2019 to 2024. The dataset covers almost 200 properties and demonstrates that proactive management has driven a shift towards electrification and increased efficiency. Key findings include:
• Electrification: In 2019, 52% of properties were heated with grid-supplied electricity; by 2024, this had risen to just over 60%. For context, across all EPCs lodged in England and Wales over the past decade, about one-third use electricity as the main fuel, 60% use gas, and the remainder use oil, biogas, biomass, or other sources.
• Regulatory performance: This shift, alongside other interventions, has improved EPC performance: by end-2024, 5% of properties were rated A, 32% B, and 32% C. The average EPC score improved from 80 (band D) in 2019 to 64 (band C) in 2024. Nationally, the average is 72 (low band C).
• Reduced consumption and footprint: Total energy consumption across the portfolio fell by 18% between 2019 and 2024, with emissions down 29% using standard carbon factors.
This demonstrates the impact of measuring energy and implementing asset-level optimisation. Yet, all these datapoints must be combined with other key metrics for holistic building management to reach sustainability goals, as Claire notes, “EUI always needs to be considered alongside other building metrics such as occupancy for greater insight and understanding.”
Significant annual cost savings can be achieved by improving energy efficiency and optimising energy sources in office buildings. By way of example for a 100,000 sq ft office, reducing energy intensity from the average ‘typical practice’ (TP – 50th percentile) to ‘good practice’ (GP – 25th percentile) delivers notable savings. According to the REEB 2024 benchmarks:
For an all-electric building, the gap between TP and GP is 24 kWhtotal/m² GIA/year, which equates to about £61,000 savings per year.
- For a mixed-fuel building, the gap is 32 kWhtotal/m² GIA/year (electric) and 29 kWhtotal/m² GIA/year (fuel), this adds up to around £95,000 in annual savings.
- If a building transitions from a TP mixed-fuel profile to a GP all-electric profile, the total annual saving could reach £114,000.
These calculations use the REEB fuel-specific gap figures and apply ONS Q1 2025 figures for non-domestic energy costs for a medium-sized business. While the greatest benefit comes from both efficiency gains and switching to an all-electric energy, demonstrating the need for a holistic approach, there are still sizeable savings from optimisation alone reaching ‘good practice’ standard.
The path forward
EUI is set to become an essential metric for occupiers and asset owners. Not all actions require significant capital expenditure; prioritising optimisation before intervention is key. The importance of EUI data is not seen purely for compliance but must be integrated and actionable - informed and complemented by other datasets where necessary - to enable more efficient and resilient real estate. Ensuring assets are efficient and sustainable is vital for value, and active property management will be increasingly necessary to achieve this.

