
Leading Indicators – July 20th
Key economic and financial metrics and what to look out for in the week ahead.
10 November 2021

Our weekly roundup of the economic and financial metrics you need to track, and what to look out for in the week ahead. This replaces our previous Daily Economic Dashboard.
In this edition:
- Oil recedes to $69/barrel as OPEC+ agrees to increase supply. This year, the price of Brent Crude increased by 43% at its peak, but has fallen to a six-week low following the agreement, which will see production rise by 2m barrels per day.
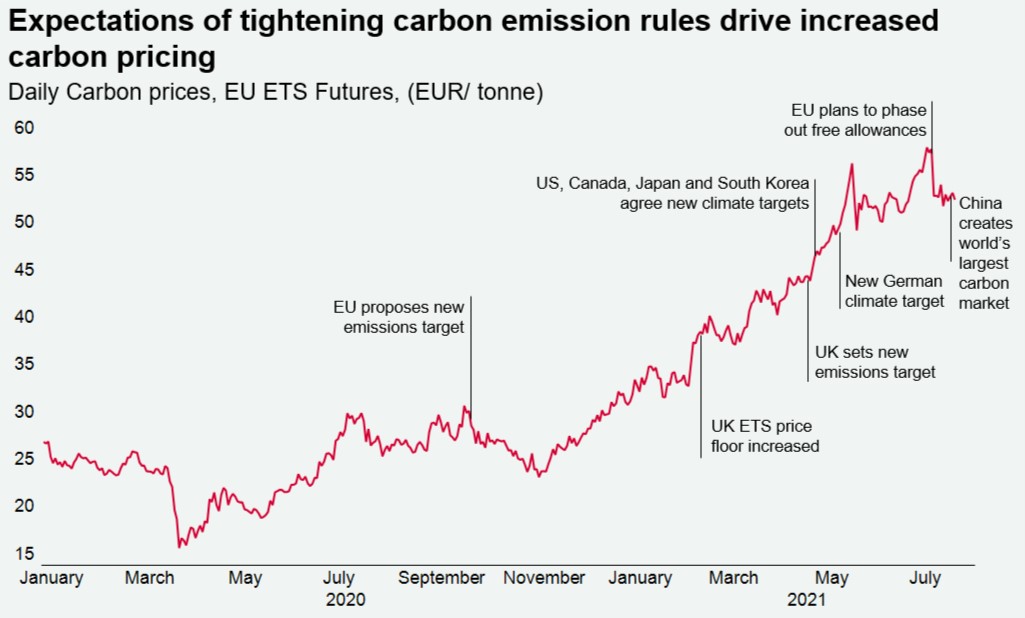
- The EU has proposed a new carbon import tariff, with potential implications for building costs. To be enforced by 2026, the tariff would apply to imported cement, aluminium and fertiliser, which could lead to rising costs for the construction industry within the EU.
- Manufacturing and services output estimates to be released this week. In the UK, manufacturing has seen a particularly strong rebound, with PMI readings (a high-frequency measure of activity levels) reaching 65.5 in May and easing to 63.9 in June. A reading above 50 is considered expansionary.
Get the latest updates.
Sign up to Knight Frank Research.