Place is no longer simply defined by geography but by performance. It’s no longer just about a submarket or specific postcode; there are fine margins and market players need to understand ‘place’ on a micro scale to understand nuance in the wider market.
London is entering one of the most exacting office market cycles of the past generation.
Strong levels of structural demand, a constrained development pipeline and a higher cost of capital are reshaping competitive dynamics across the city.
Within this environment, place has reasserted itself as a defining variable. Traditional submarket boundaries are no longer the definitive measure. Performance is now being set at a far more granular level, with differences emerging between neighbouring streets, transport nodes and clusters of activity. Understanding these nuances has become central to decision-making for occupiers, investors and developers.
At a glance
Micro-location analysis will become increasingly critical as traditional submarket boundaries lose relevance.
Occupiers must adopt street-level analysis to identify pockets of value and ensure locations align with talent attraction, amenity, and connectivity priorities.
Developers need to deliberately curate place, integrating buildings with their surroundings and enhancing amenity provision.
Midtown achieved the highest outperformance against 5-year average take-up and has one of the lowest vacancy rates.
Occupiers could consider non-core submarkets offering relative value and strong fundamentals rather than traditional core locations.
Landlords and developers in these submarkets can capitalise on strong demand and limited pipeline by accelerating delivery and enhancing amenity.
Demand clusters around micro-locations with high-quality, future-proofed stock, vibrant neighbourhoods, and excellent transport connectivity.
Occupiers must prioritise micro-locations that meet or exceed baseline expectations for amenity and connectivity.
Developers should focus on creating mixed-use, amenity-rich environments to close gaps in weaker locations.
Our second paper in The London Series 2026 explores the role of place in the London office market.
Place is one of four variables in the London Equation, our framework for understanding how the city competes.
What the data shows
To interrogate place as a variable, Knight Frank has developed a bespoke Submarket Performance Index (SPI), designed to capture how different parts of the London office market are performing in a post-pandemic context.
The objective is to combine established metrics, drawing together demand, supply, rental performance, connectivity and amenity provision into one framework. The SPI assesses 20 London submarkets against the following metrics, based on quarterly data from the end of Q3 2025:
Last 12 months take-up vs 5-year average
Volume of space under offer as % of total stock
Overall vacancy rate
New/refurbished vacancy rate
Prime headline rent
Percentage of available space within a 5-minute walk of an Elizabeth Line station
Development pipeline as % of total stock
Projected undersupply as % stock
Prime rental growth (last 5 years)
Forecast prime rental growth (next 5 years)
Amenity score – this looks at a comprehensive list of office user amenities including retail, leisure, health & wellbeing and hospitality, as well as their overall transport connectivity.
Figure 1: Submarket performance index (SPI)
The initial results contain a combination of:
Confirmation of the two most established submarkets' strong performance and,
Surprising results from submarkets that sometimes go under the radar.
Both the West End Core and City Core perform well against nearly all 11 metrics within the model, although the West End Core achieves a higher overall average score due to outperformance in amenity offering and vacancy rate.
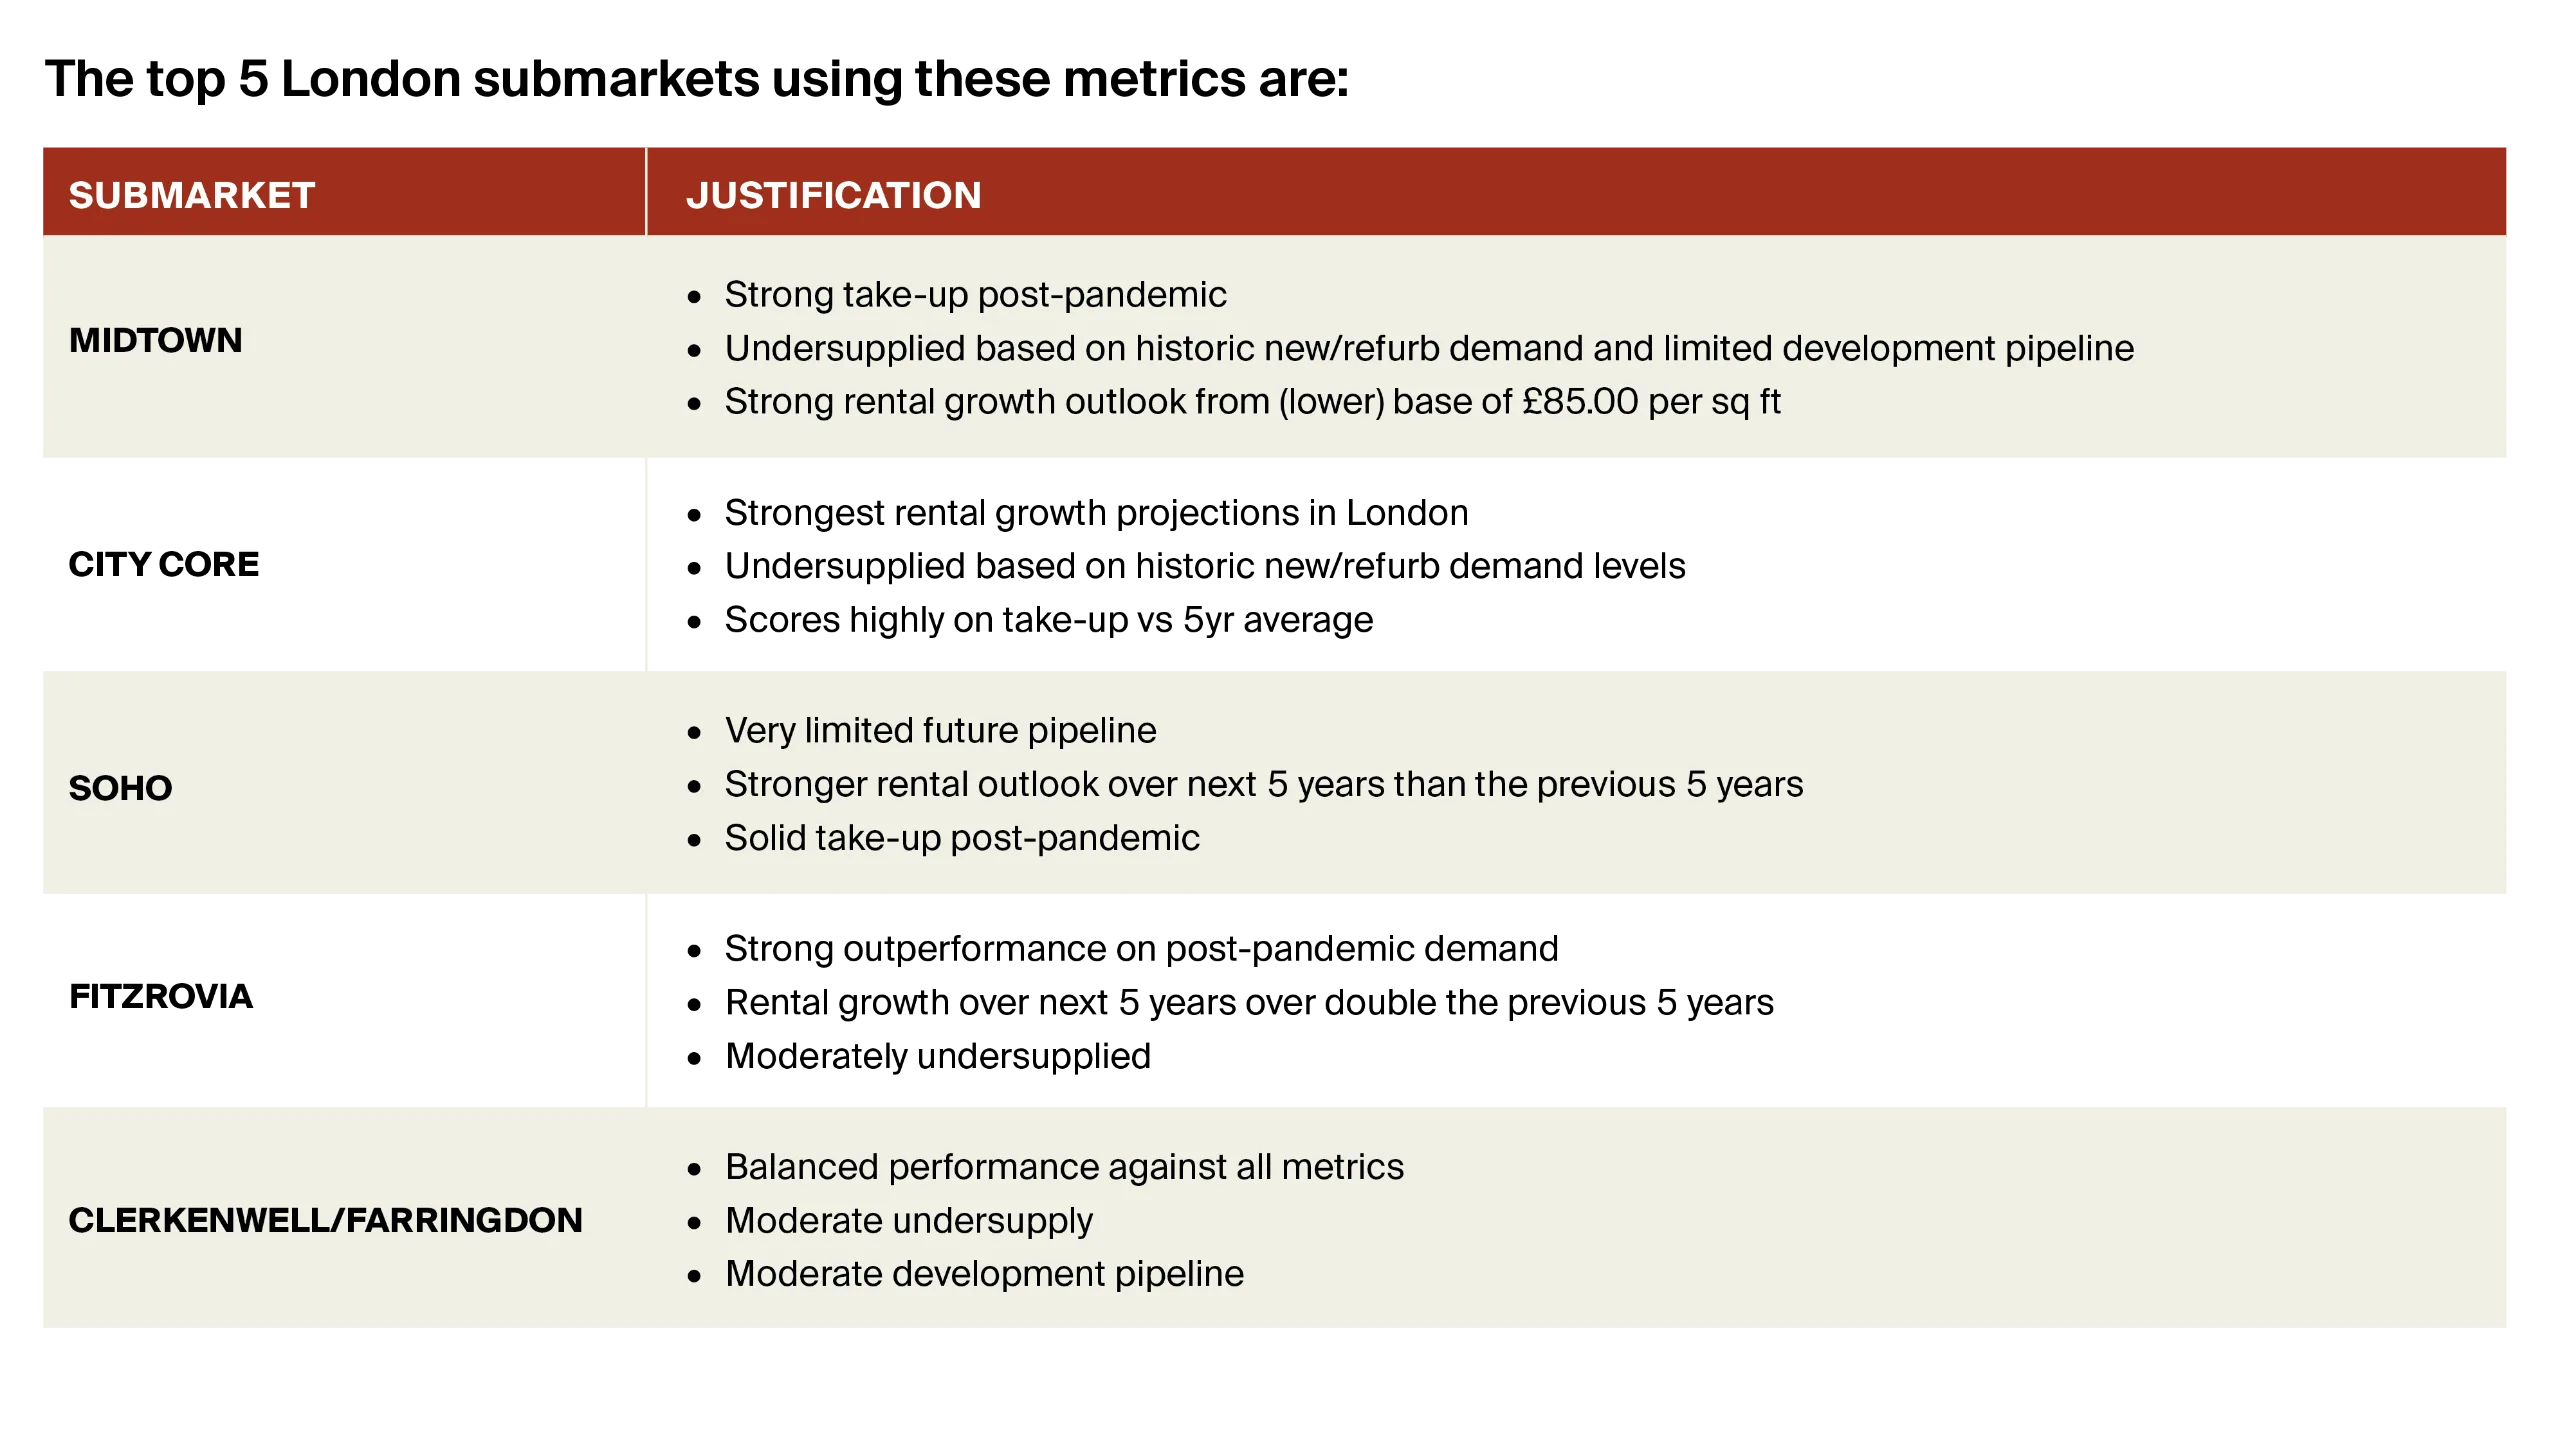
Midtown featuring so highly on the index is a slight surprise. The underlying performance of the submarket has been strong over the last 12 months, achieving the highest outperformance against 5-year average take-up across all 20 submarkets.
Low new/refurbished vacancy combined with a cumulative forecast rental growth of 20.6% over the next 5 years suggest that Midtown is set to continue performing well.
The adjacent Clerkenwell/ Farringdon submarket has also performed well overall, although higher vacancy rates compared to other submarkets impact its average score. Stronger rental growth is predicted over the next 5 years (18.9%) than the last 5 years (17.1%) and the high volume of space under offer at the time of writing suggests both the near-term and long-term outlook are positive.
Another location that has seen a recent change in fortunes is Canary Wharf. With a recent run of strong leasing activity, as well as a high proportion of available space being within a 5-minute walk of the Elizabeth Line station, Canary Wharf provides evidence that reinvention of place can lead to a return of performance.
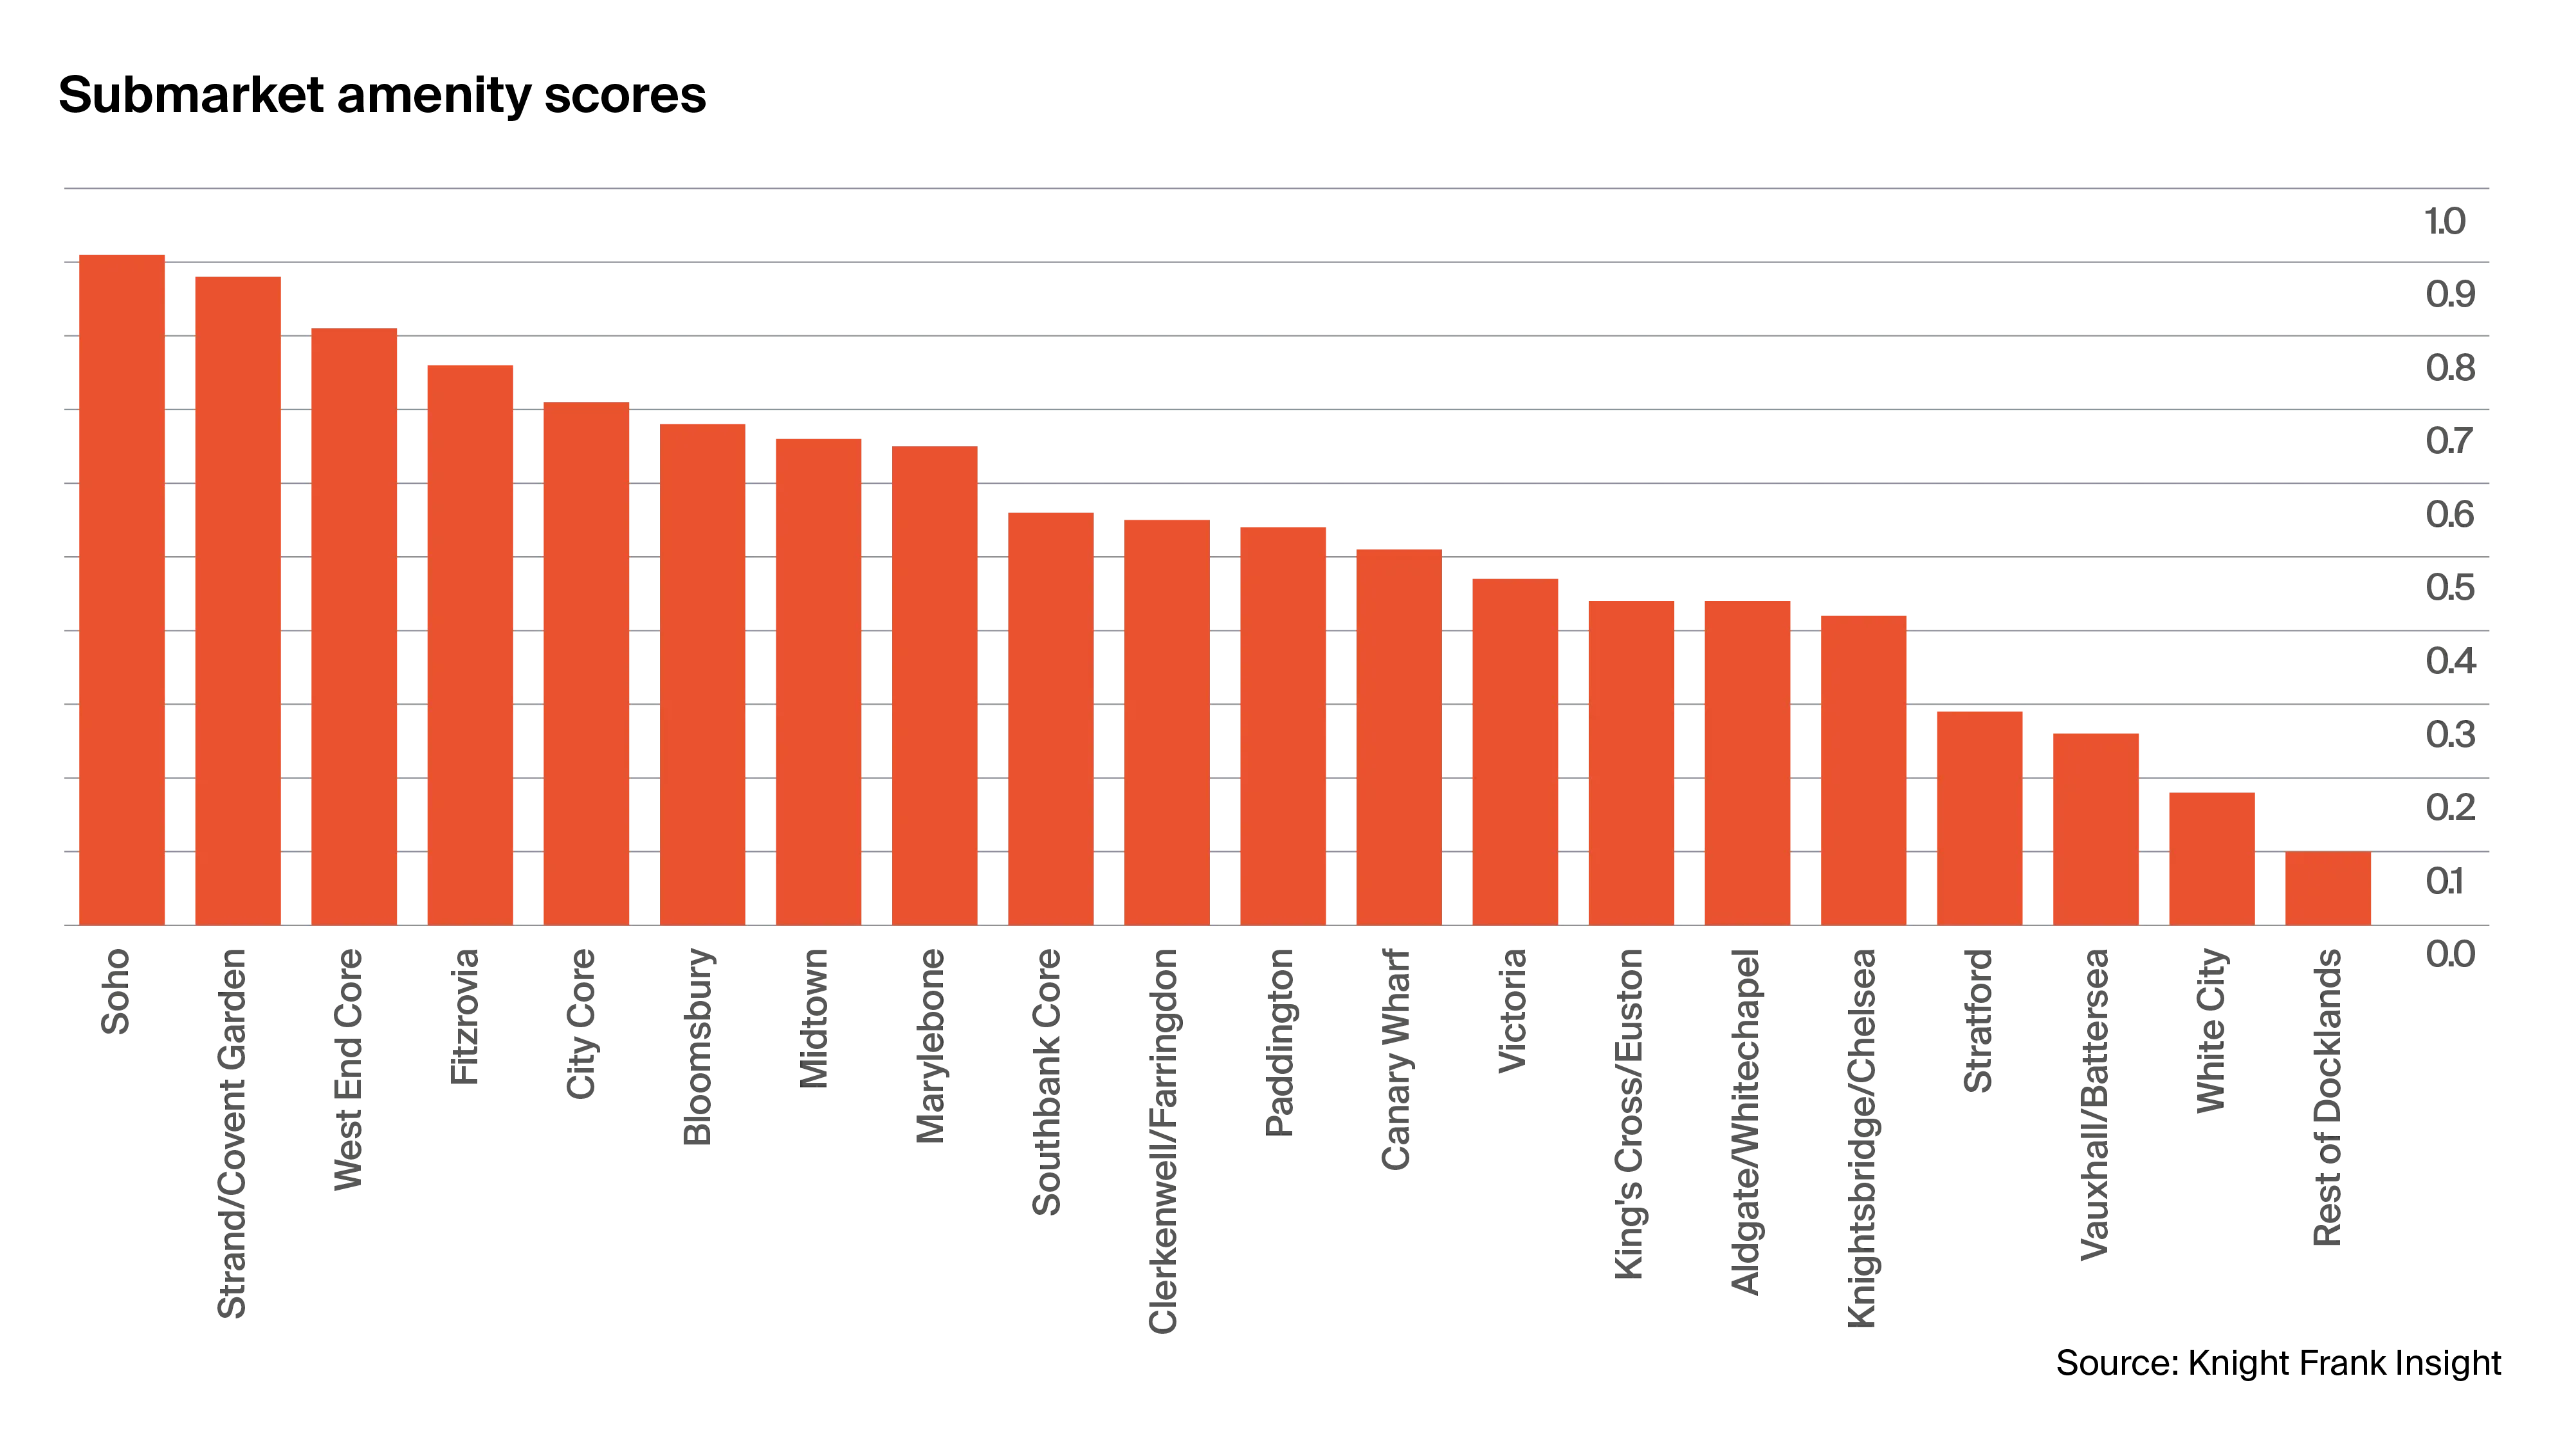
Another interesting element of the SPI results is the scores achieved for amenity provision. West End submarkets are most likely to achieve a higher overall score due to retail and leisure provision, although the City Core, Midtown and Southbank Core all perform well in this regard.
Figure 2: Submarket amenity score
Beyond the SPI: Nuance at the micro level
Whilst the SPI provides a useful barometer for overall performance, the nuance involved in the London office market means analysis often needs to be conducted at a more localised scale.
Even within lower-performing locations, there are pockets of outperformance whilst the inverse can also be found in core submarkets. This paper explores three submarkets as examples of how performance of place can change dramatically down to a street level.
West End Core: pockets of rental outperformance
The West End Core achieved the highest average score in the SPI, but this performance isn’t universal across Mayfair and St James’s as a whole.
There are specific streets and hotspots where proximity to the Elizabeth Line, depth of amenity and higher average rent achieved co-exist. Conversely, there are ‘notspots’ where achieved rents are significantly lower than the wider submarket.
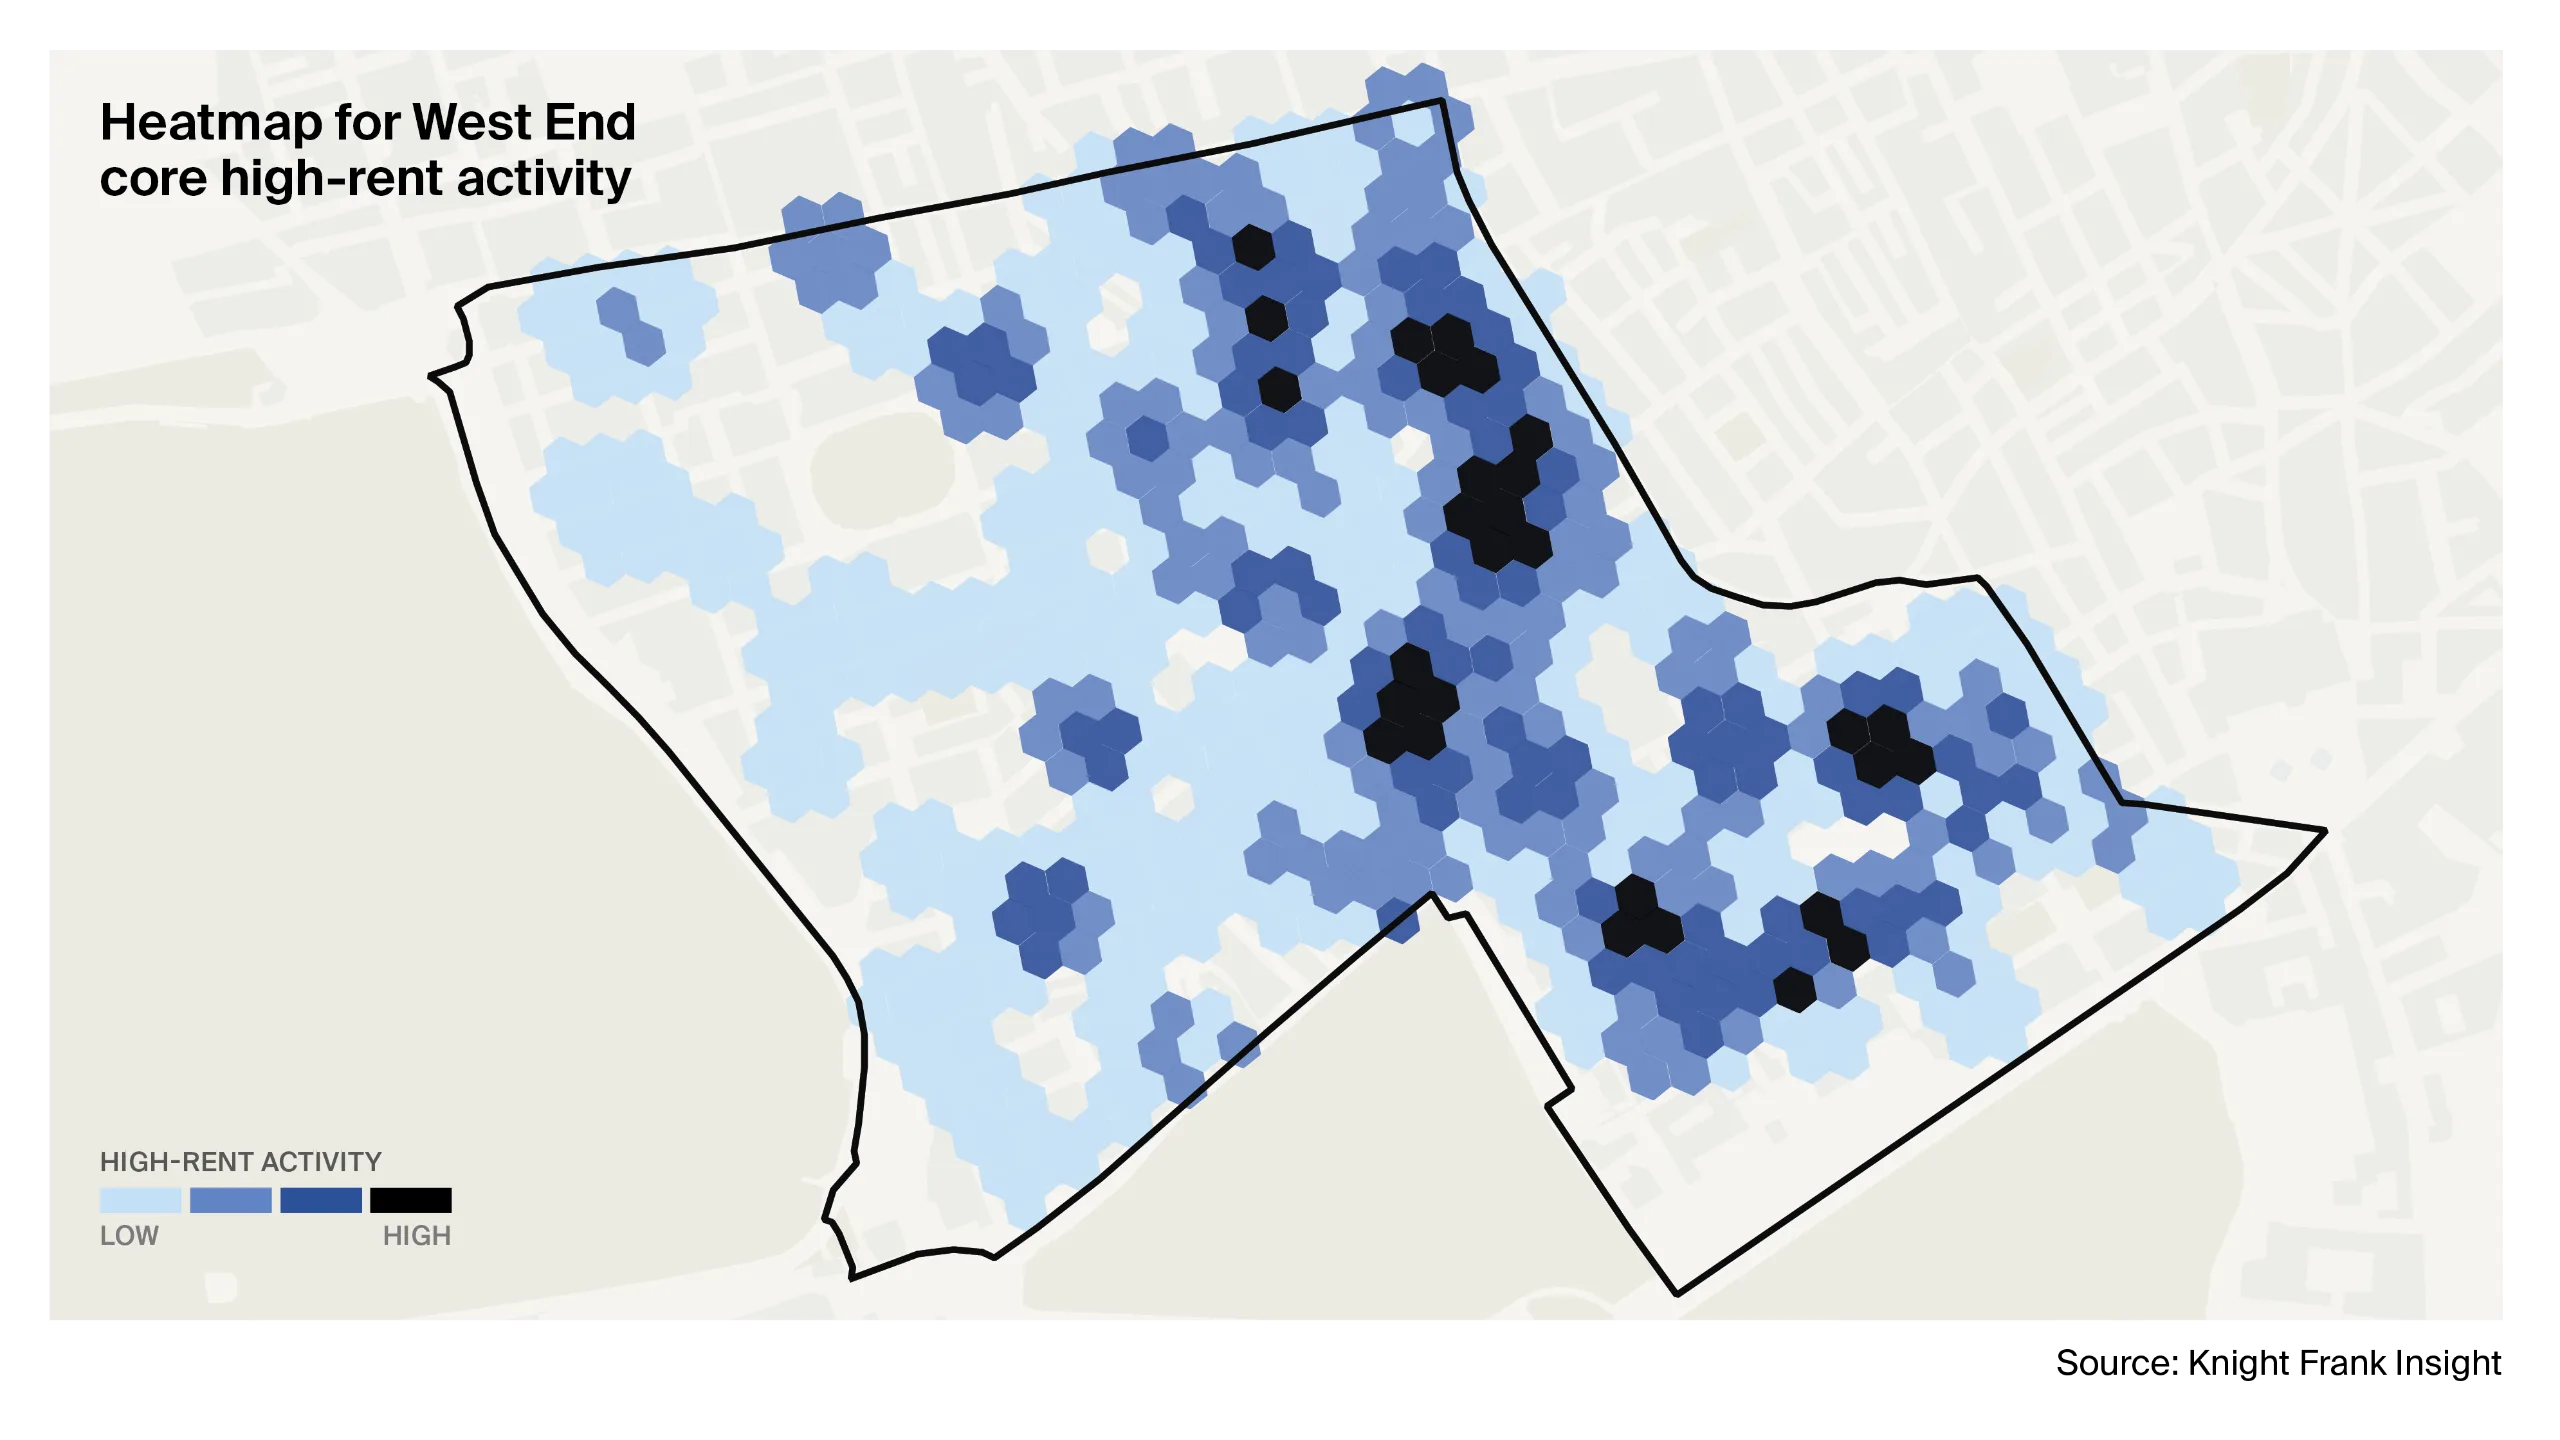
The heatmap in Figure 3 shows the average headline rent achieved for all West End Core transactions since January 2021 (excluding managed deals). The dark blue locations show where a higher density of high-rent activity has taken place post-pandemic.
Figure 3: Heatmap for West End Core high-rent activity
What emerges is that specific streets have seen stronger rental performance post-pandemic. For Mayfair, buildings located on the Eastern edge of the submarket have seen higher rents achieved, whilst the Western side has seen lower rents secured. For St James’s, rental performance appears around St James’s Street and St James’s Square, and is linked to proximity to transport links at Green Park and Piccadilly Circus.
City core 'quadrants'
The City Core submarket holds the highest volume of office stock in London, with 70.5m sq ft of built office space, and has seen strong occupational demand in recent years, with 3.86m sq ft let in the 12 months up to Q3 2025.
Prime rents have grown by a third over the last 5 years, with a similar growth anticipated over the next 5 years. Different dynamics are at play within the City Core. One way of analysing this is to look at the component postcode districts within the submarket – EC1, EC2, EC3 and EC4.
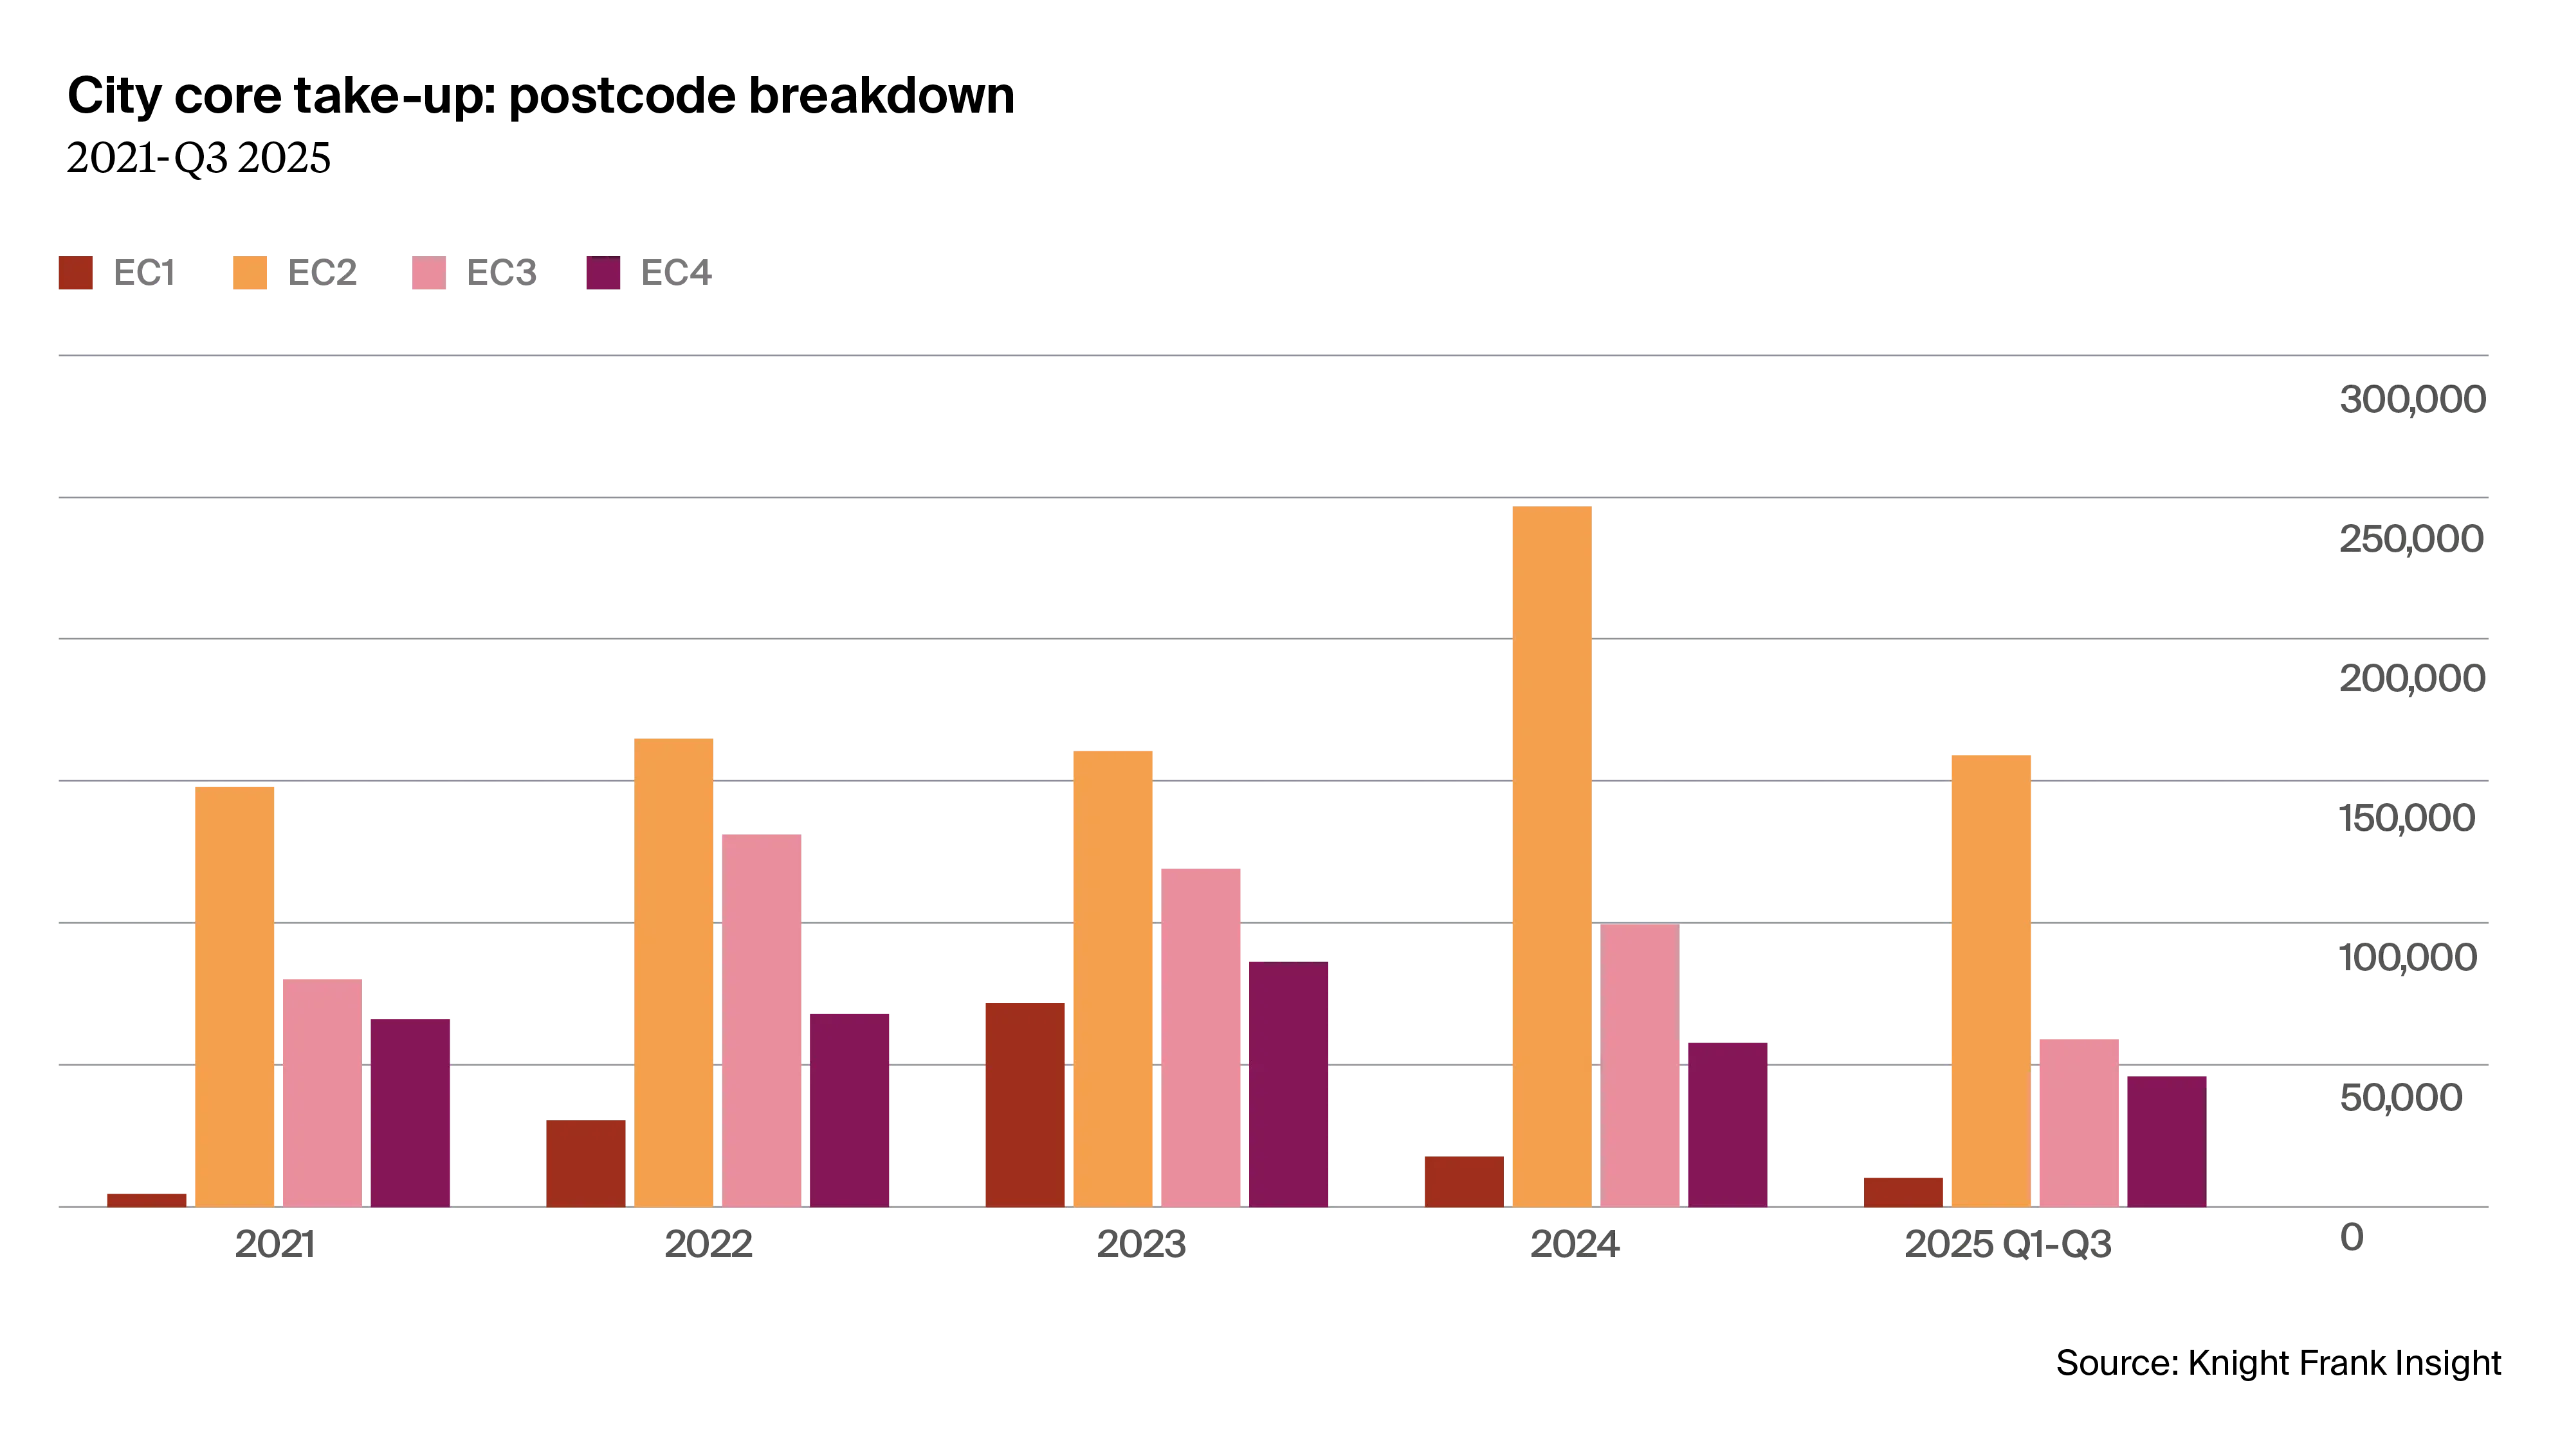
Figure 4: City Core take-up postcode breakdown
Figure 4 shows City Core take-up since 2021 split between the four postcodes. The EC2 district sees the highest overall take-up in that period, with 8.8m sq ft of take-up, representing 48.1% of all leasing activity in the City Core since 2021. However, this broadly reflects the proportion of overall supply in the EC2 district, which accounted for 43.6% of total availability in the City Core at the end of Q3 2025.
EC3 has also seen strong performance, boosted in part by the tower cluster that has seen significant demand in recent years in schemes such as 40 Leadenhall and One Leadenhall. Similar trends emerge when looking the average rents achieved in each postcode district.
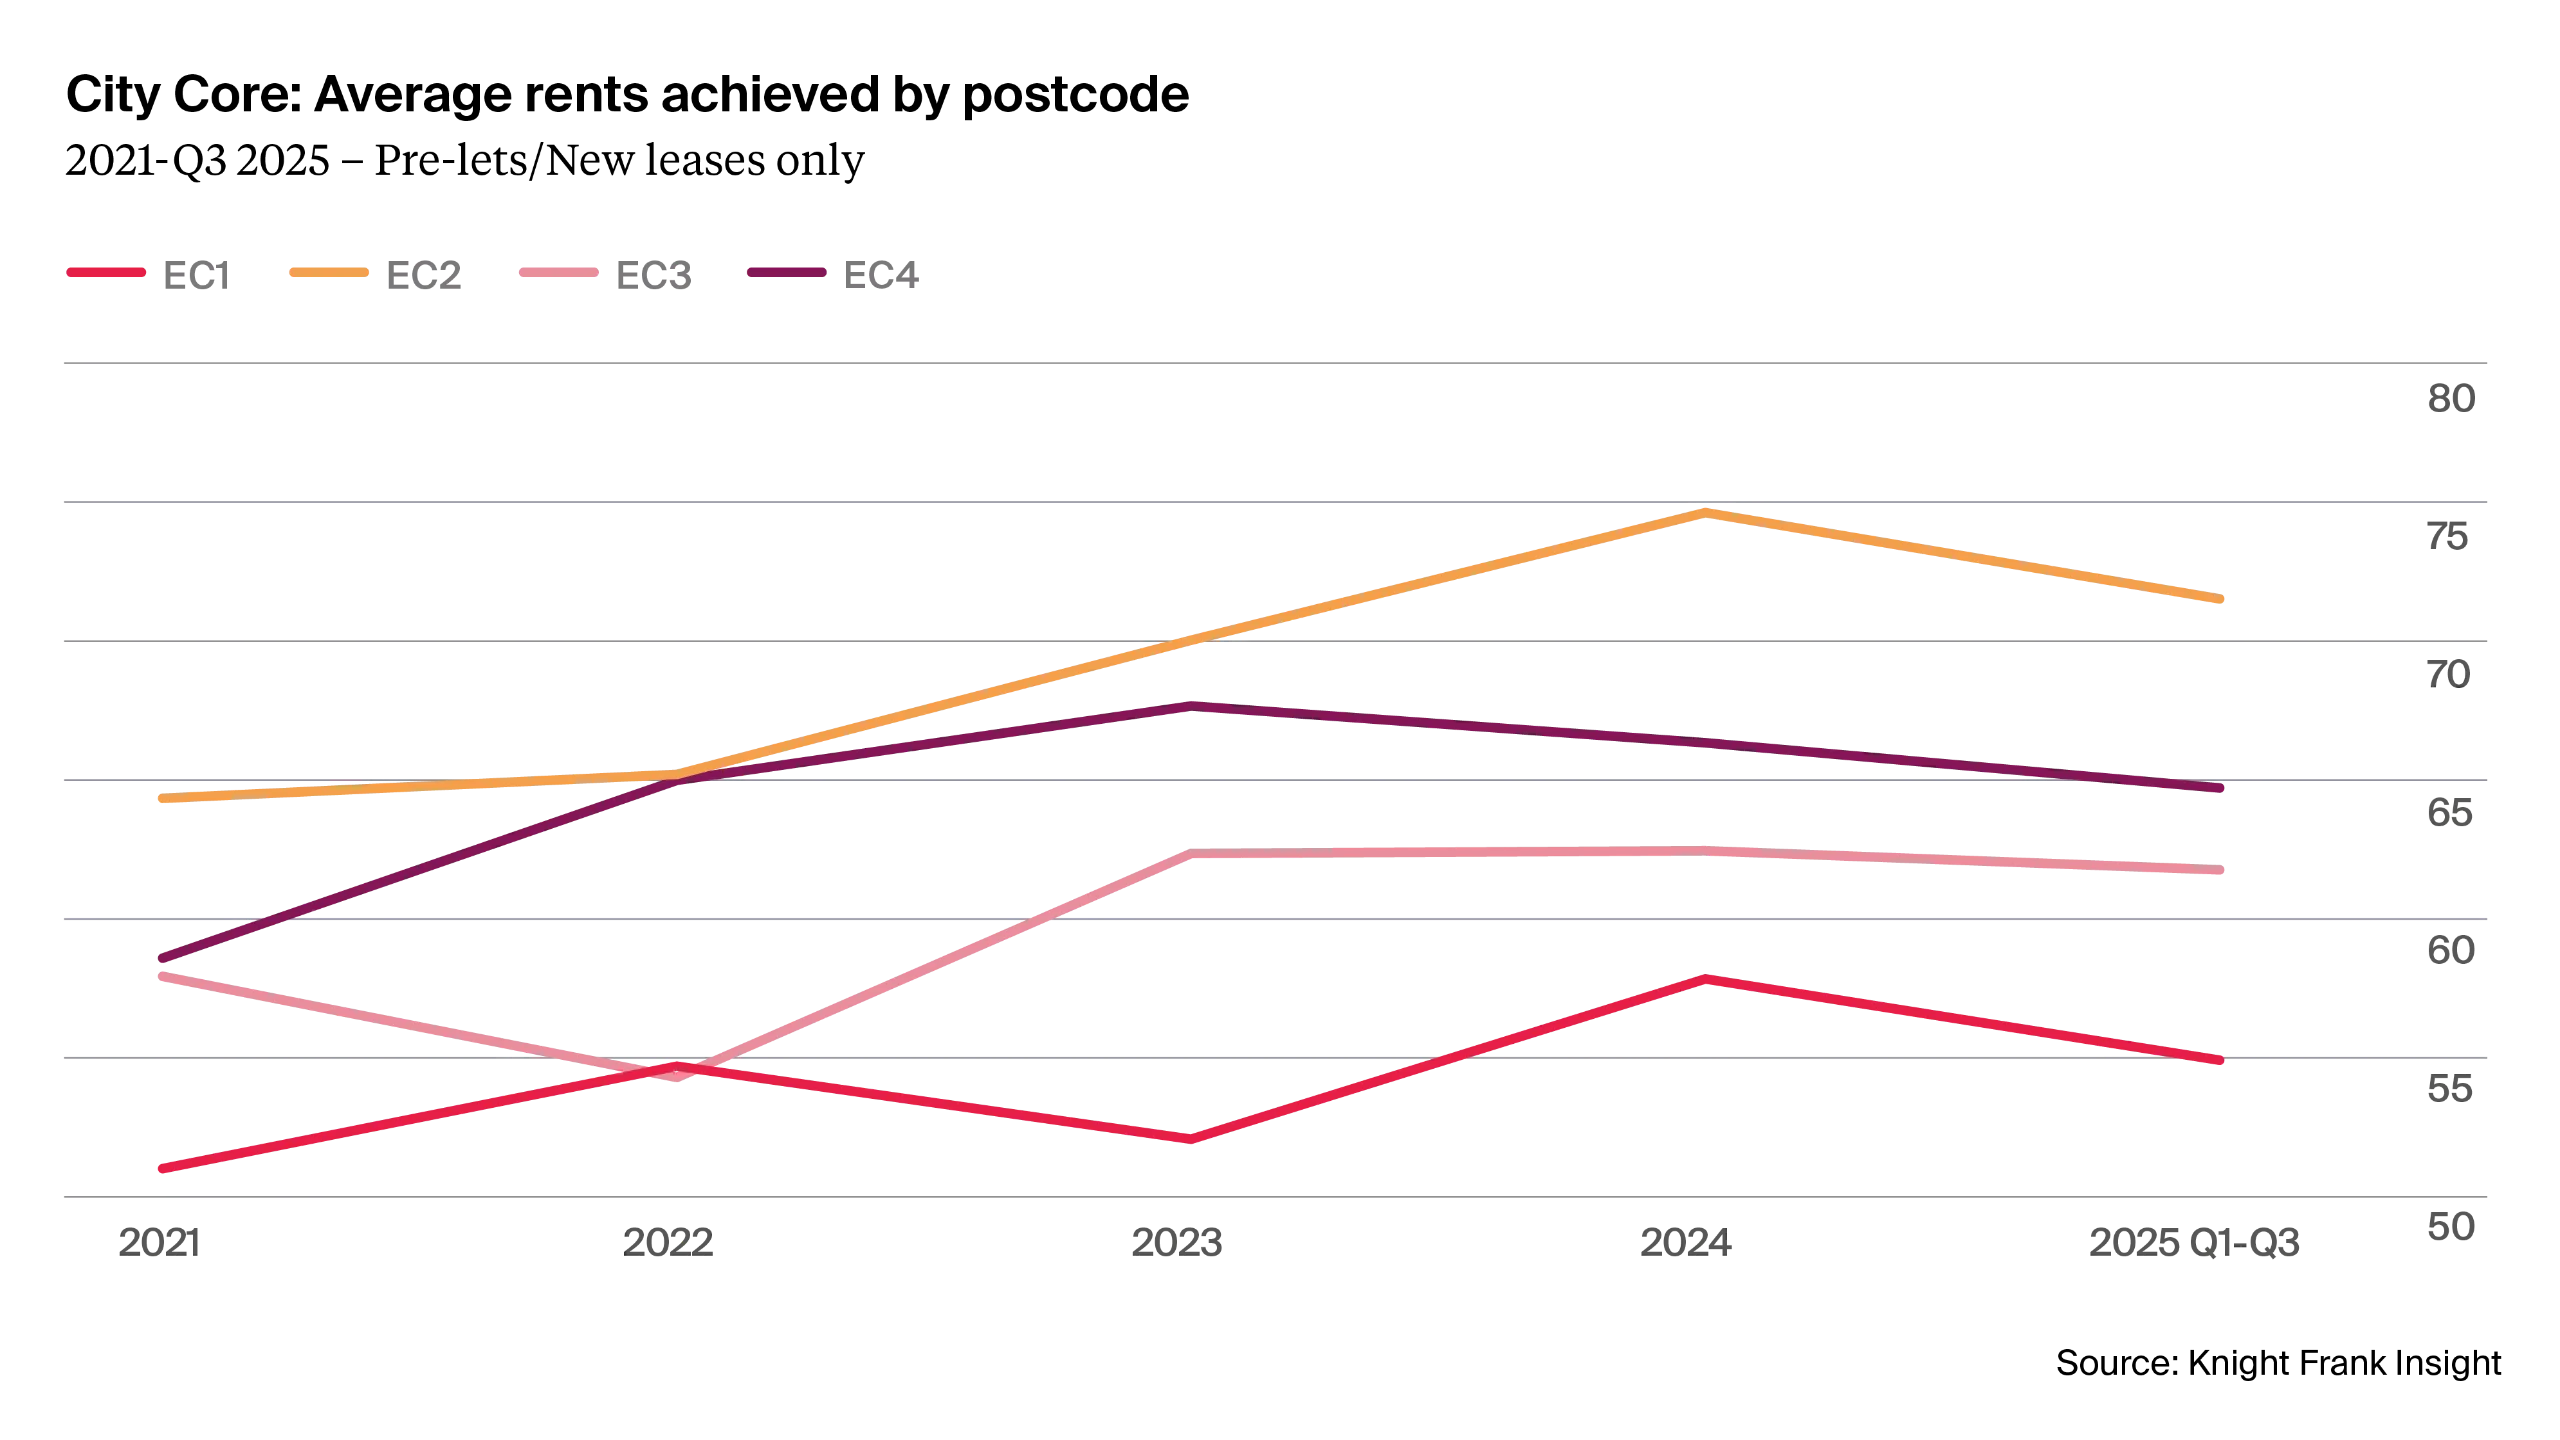
Figure 5: City Core average rents achieved by postcode
Across all pre-let or new leases signed since 2021, the EC2 district has seen an overall average achieved rent of £69.86 per sq ft, compared to £54.46 per sq ft in EC1, £65.30 per sq ft in EC4 and £59.65 per sq ft in EC3. Clearly, these average rents mask the increase in prime rents achieved in the locations, where prime rents in the City Core reached £100.00 per sq ft in Q3 2025 and upper floors in towers are achieving rents approaching £150.00 per sq ft.
The outperformance of the EC2 district perhaps reflects a shift in what can be considered the “core of the core”, shifting north from Bank station (in EC3) towards Liverpool Street station (EC2) and the sought-after Elizabeth Line connectivity it provides.
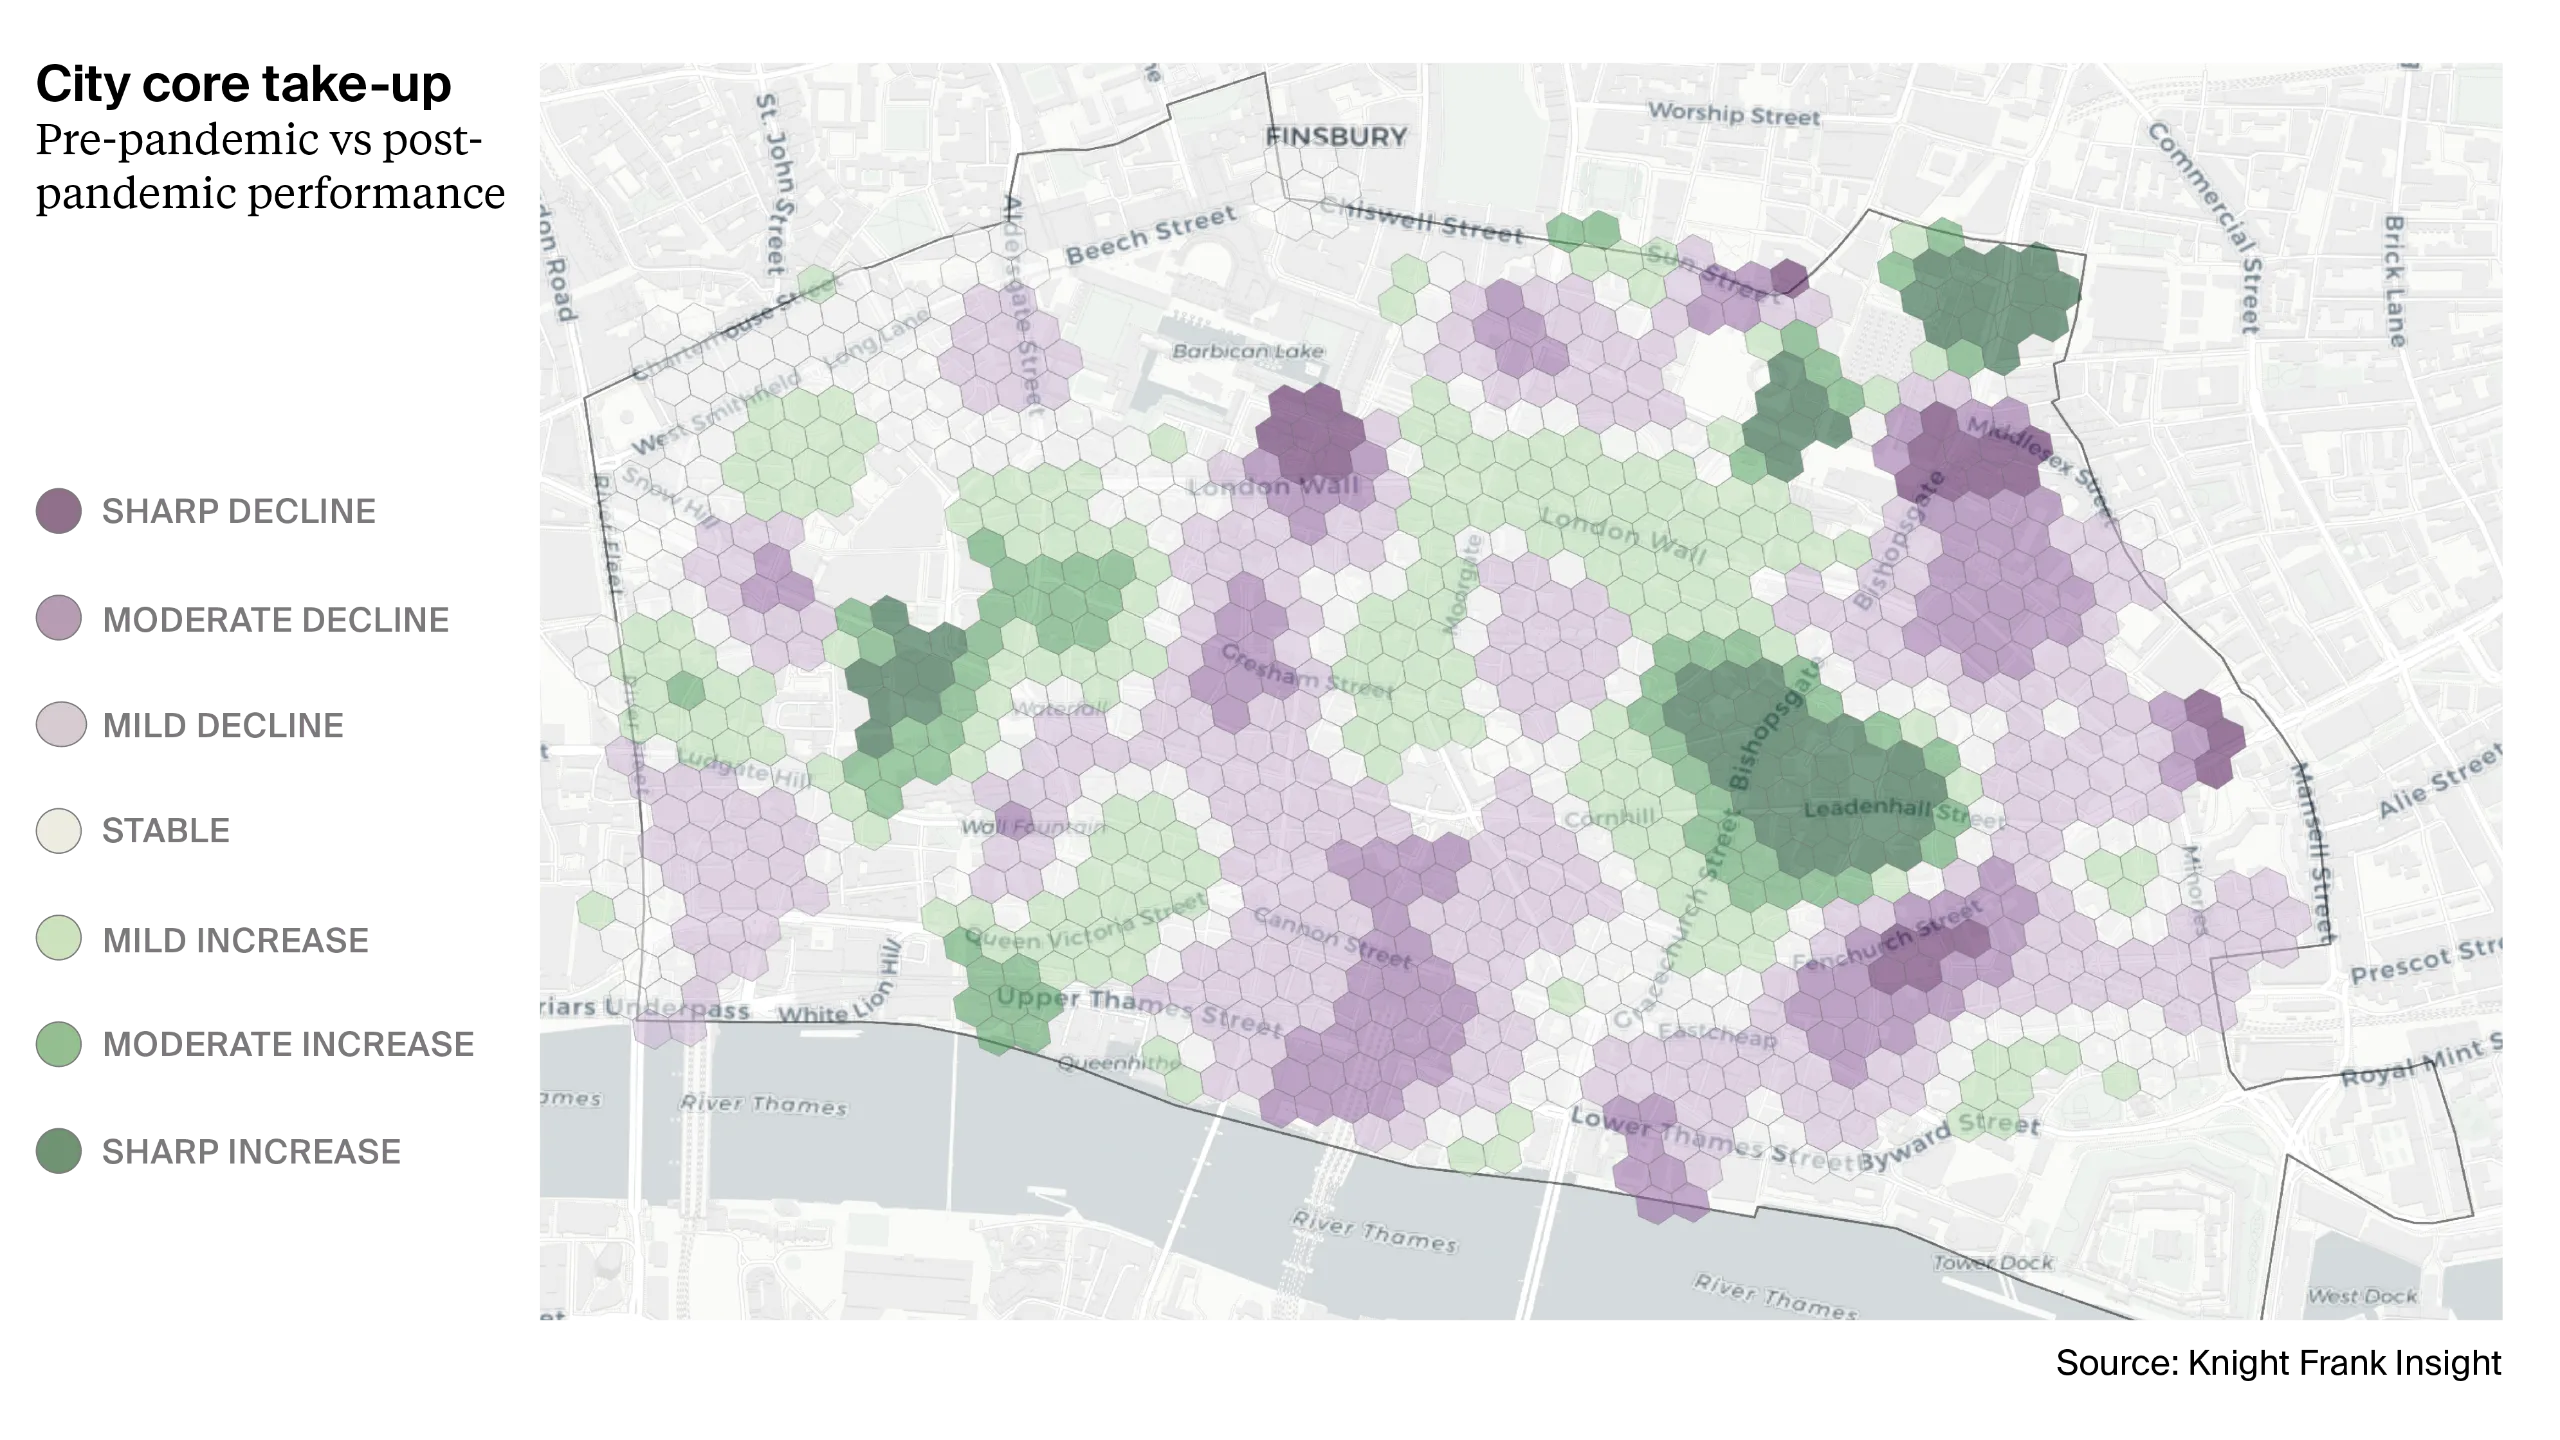
Figure 6: City Core take-up - pre-pandemic vs post-pandemic performance
This gradual shift away from Bank Station is demonstrated in the heatmap above, which shows take-up within the City Core submarket broken down into smaller hexagons to show the change between the five years leading up to the pandemic (2016-2020) and then the five years subsequently (2021-2025). Darker green locations have seen greater activity in the last five years, whilst darker purple hexagons show less activity in that period.
The tower cluster to the east of Bank Station has seen strong activity and the smaller clusters at Broadgate and to the Eastern side of Liverpool Street station are clear. This is an indication of the micro-locations that provide the necessary quality and volume of available office space.
There are instances where other City Core districts outperform EC2. For example, the EC1 district has seen a much higher proportion of pre-let activity as a proportion of overall take-up since 2021 (74.9%) than EC2 (32.3%). This is significantly impacted by HSBC’s 520,359 sq ft prelet which signed in Q4 2023.
This ‘outlier’ deal also impacts the proportion of new/refurb take-up in EC1, which reached 87.1% over the last five years, compared to 76.0% in EC2. EC3 has seen a more balanced proportion, with 55.5% of all take-up being for new/refurb space, whilst the EC4 district saw 61.1%.
Midtown: No longer middle of the pack?
When explored as part of the SPI, Midtown has outperformed in both demand and supply.
Midtown had one of the lowest overall submarket vacancy rates (5.9%), which was more acute for new/refurb space (2.3%). With headline prime rents of £85.00 per sq ft, Midtown also provides relative value compared to other nearby locations e.g. the City Core.
This performance is likely to continue, but the development pipeline in Midtown might be a limiting factor, with just 0.45m sq ft of speculative space under construction at the end of Q3 2025.
This supply-side shortfall is perhaps why prime rents are forecast to grow by 20.6% over the next five years, one of the strongest growth rates across submarkets.
As part of the SPI, we assessed the overall amenity provision in each submarket. Midtown achieved the 7th highest score out of 20 submarkets but was the second ‘City’ submarket behind the City Core. So, at a submarket level Midtown seems appealing to a wide audience, with value in headline rents, strong fundamentals in rental growth, and an above average amenity offering.
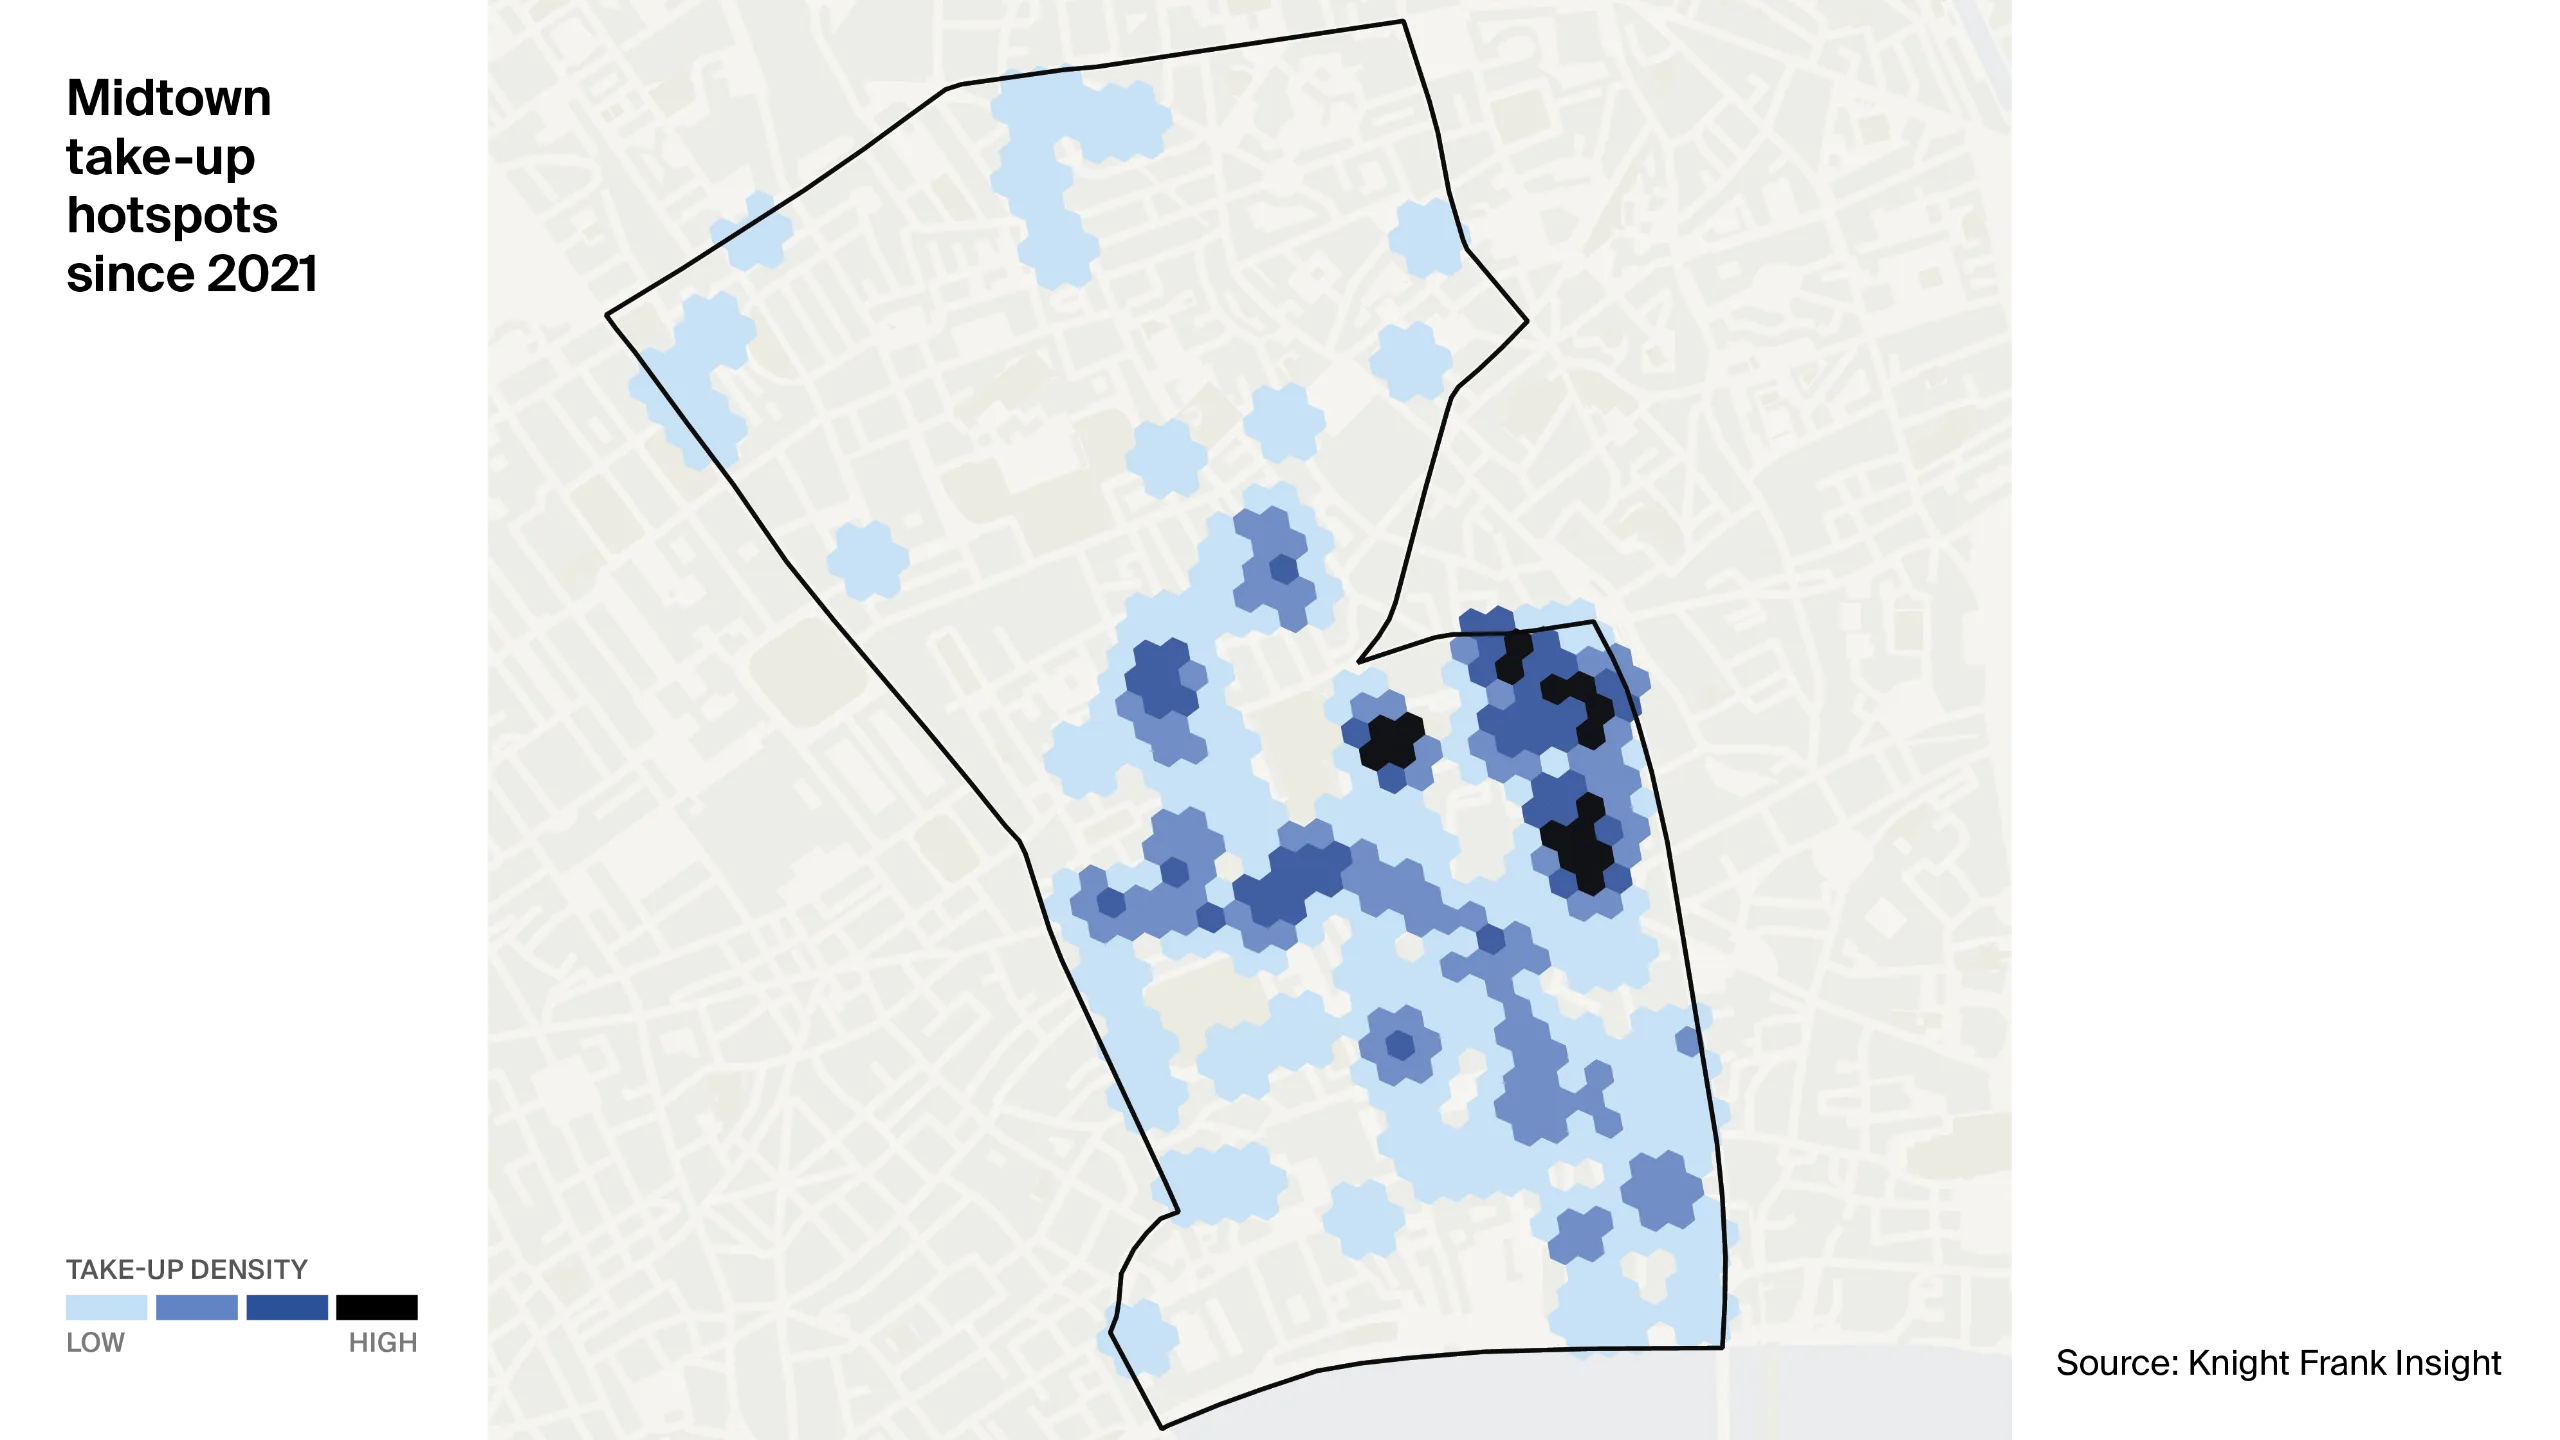
Figure 7: Midtown take-up hotspots since 2021
Figure 7 shows take-up in Midtown since 2021, with the dark blue representing higher levels of take-up post-pandemic. There is a clear hotspot near to Chancery Lane and Farringdon station, highlighting the importance of connectivity.
Implications for the market
The London office market is experiencing a rapid fragmentation of performance, between and within submarkets. The SPI reveals core locations are no longer uniformly strong, nor are fringe areas consistently weak.
Instead, demand is clustering around micro-locations that combine high-quality, future-proofed stock with vibrant neighbourhoods and excellent transport connectivity. These attributes, which were once differentiators, are now becoming baseline expectations.
Oversupply risk is also becoming highly localised. While some micro-locations within established submarkets are showing early signs of saturation, others are experiencing genuine shortages of Grade A space. This uneven distribution has direct consequences for rental growth, capital values, and liquidity.
The playbook for market participants
For occupiers
Selecting the right place is now as important as choosing the right building.
Locations that excel in amenity, connectivity, and relative value are best positioned to attract talent and support productivity.
Micro-location analysis is needed to find pockets of value even within more costly districts.
For investors
The accelerating divergence in performance creates new opportunities and heightened risks.
Value will increasingly be found through forensic, street-level underwriting, rather than broad submarket analysis.
Capital will be best protected in locations characterised by scarcity, resilience, and sustained activation, especially those in lively, mixed-use neighbourhoods.
For developers
The imperative is to curate place as deliberately as product.
Buildings that integrate with their surroundings and foster cultural and community engagement will outperform.
In legacy office districts, reprogramming through mixed-use, leisure, and educational offerings will be essential to create vibrant, all-day ecosystems.
The outlook in the short and long term
In the near term, the London office market is set to remain highly polarised, with the flight to quality becoming even more pronounced.
The strongest micro-locations will continue to outperform, maintaining pricing power and attracting sustained demand. Conversely, areas lacking these attributes are likely to face ongoing pressure.
Micro-location analysis will become increasingly critical, as market averages and traditional submarket boundaries lose relevance. Decision-makers must adopt a granular, street-level approach to identify both risks and opportunities.
Looking further ahead, locations currently scoring lower on the SPI are expected to pursue repositioning strategies, including mixed-use development and reimagining place.
Infrastructure investment, particularly in transport connectivity, will be essential for unlocking the potential of emerging districts and addressing structural undersupply in core markets.
As government and private sector collaboration intensifies, London’s competitive landscape will continue to evolve, with new opportunities arising for those able to anticipate and respond to shifting market dynamics.
Ultimately, the outlook for the London office market is one of ongoing transformation.
Success will depend on the ability to interpret nuanced data, embrace innovation in placemaking, and remain agile in the face of rapid change. This success will occur at an increasingly granular level.
Read the full paper
Access all the details from Insight 2 in The London Series 2026.