The global economy in five charts
A round-up of the latest economic news and trends shown in five charts
4 minutes to read

This week the number of confirmed Covid-19 cases globally surpassed 20 million, a sombre milestone in the pandemic. Here we chart the seven-day moving average of daily confirmed cases across world regions which shows that it has been declining in North America, Africa and Australasia whilst it is rising across Europe, Asia and the Middle East.
Latin America remains a global hotspot accounting for 28% of all cases and a third of daily new cases over the past seven days. Whilst North America accounts for 26% of all global cases, over the past seven days it has accounted for a fifth of new cases, behind Asia’s 28%. The growth in daily cases in Asia is being pushed by India’s number where the seven-day average was 61,729 on 12 August.
The rising numbers in Europe are being driven by Spain and France largely whose latest seven-day averages were 3,431 and 2,216 respectively. This is causing some countries, such as the UK, to consider re-imposing or re-imposing quarantine and travel restrictions.
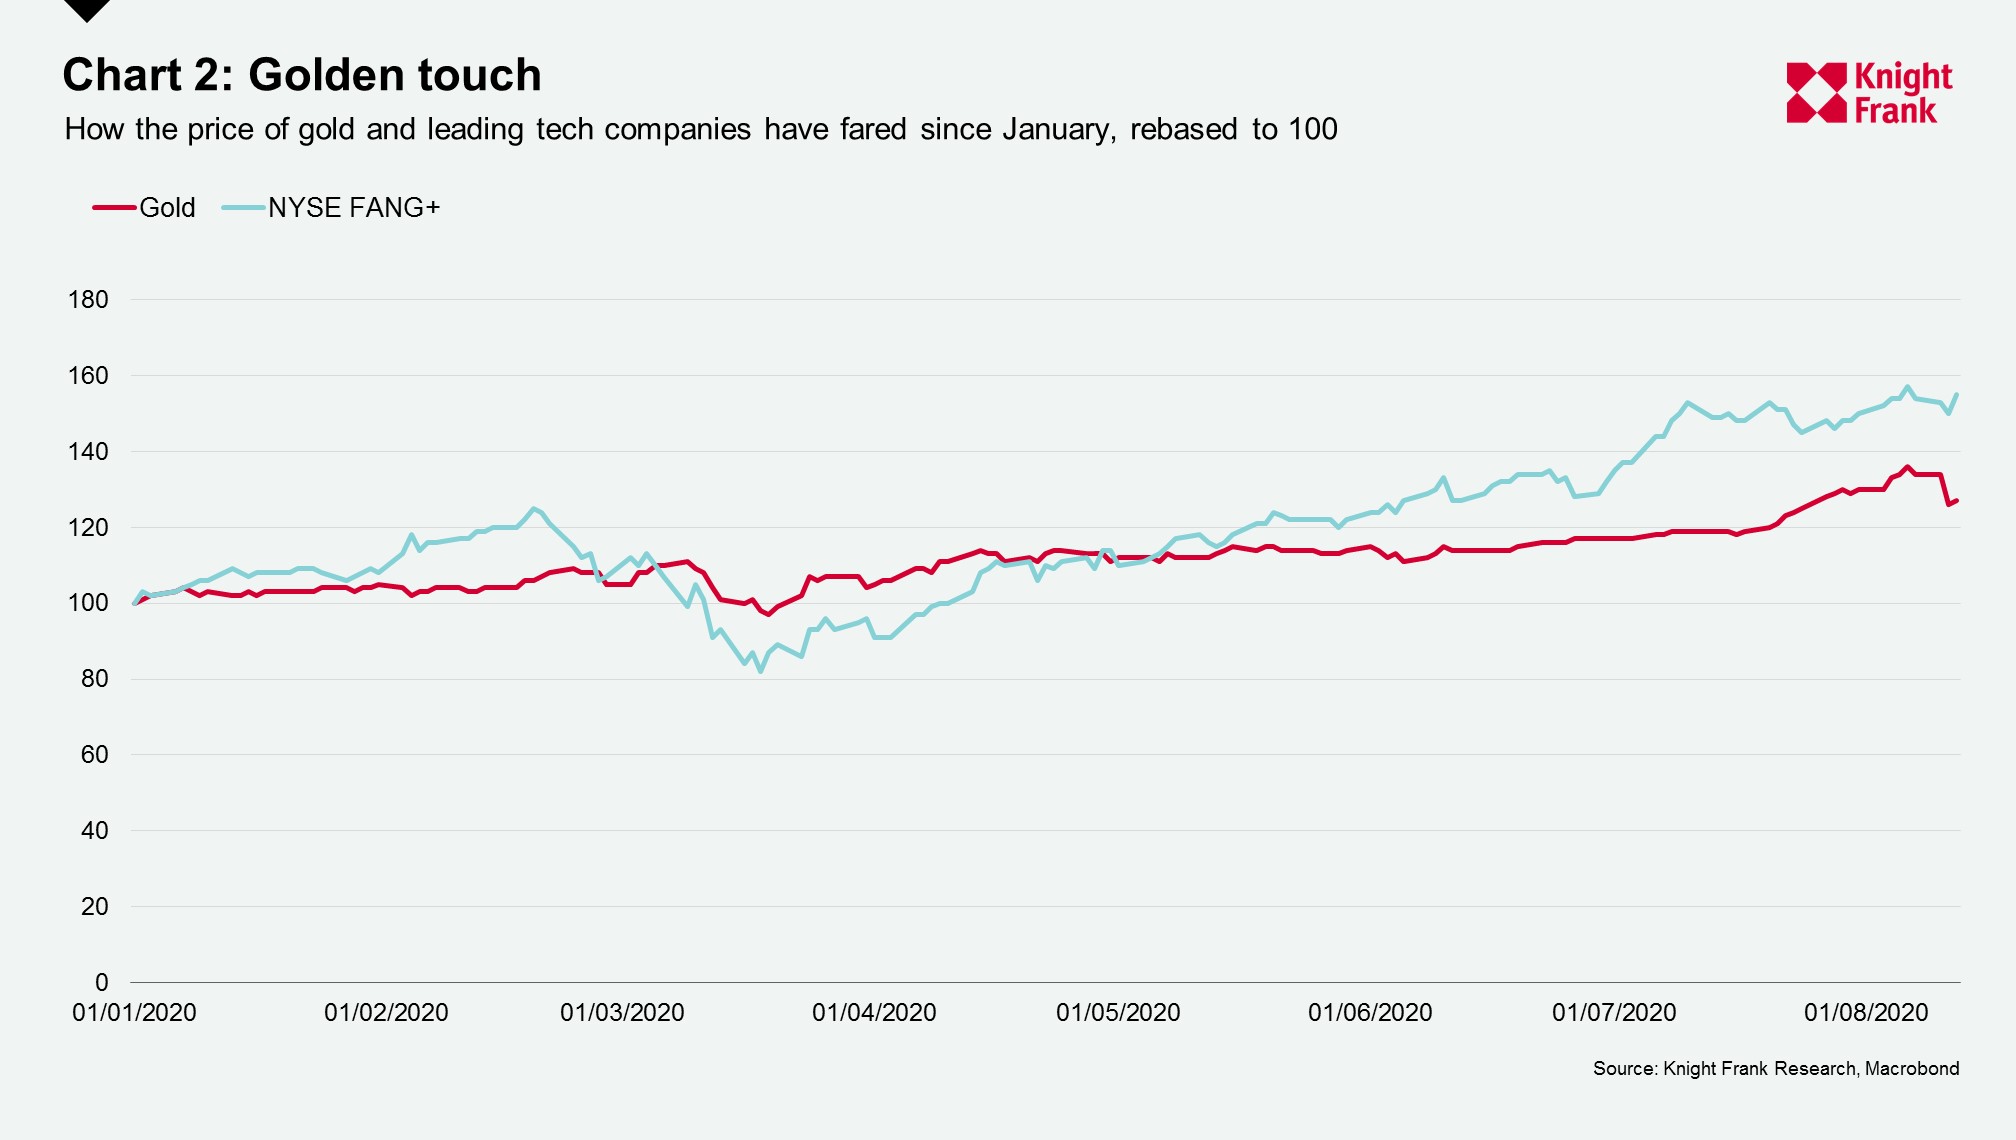
Global uncertainty has pushed investors into what are considered safe haven assets in gold and technology. In the chart above we show the price of gold and the FANG+ index, which tracks a select group of highly-traded growth stocks of next generation technology and tech-enabled companies.
Since January 2020 we have seen gold hit record highs closing at over $2,060 an ounce last week. Despite a drop in recent days, gold still sits 27% higher than where it was at the beginning of the year. Much of this is evidence of a flight to safety, but it is also benefiting from the relative weakness of the dollar since July.
Whilst the FANGS+ index saw a tumble in late March, as with other equity indices, the performance of tech-related companies has boosted the index, which now stands 55% higher than at the start of the year. Amazon’s share price has risen by 71% over that time to $3,162 a share.
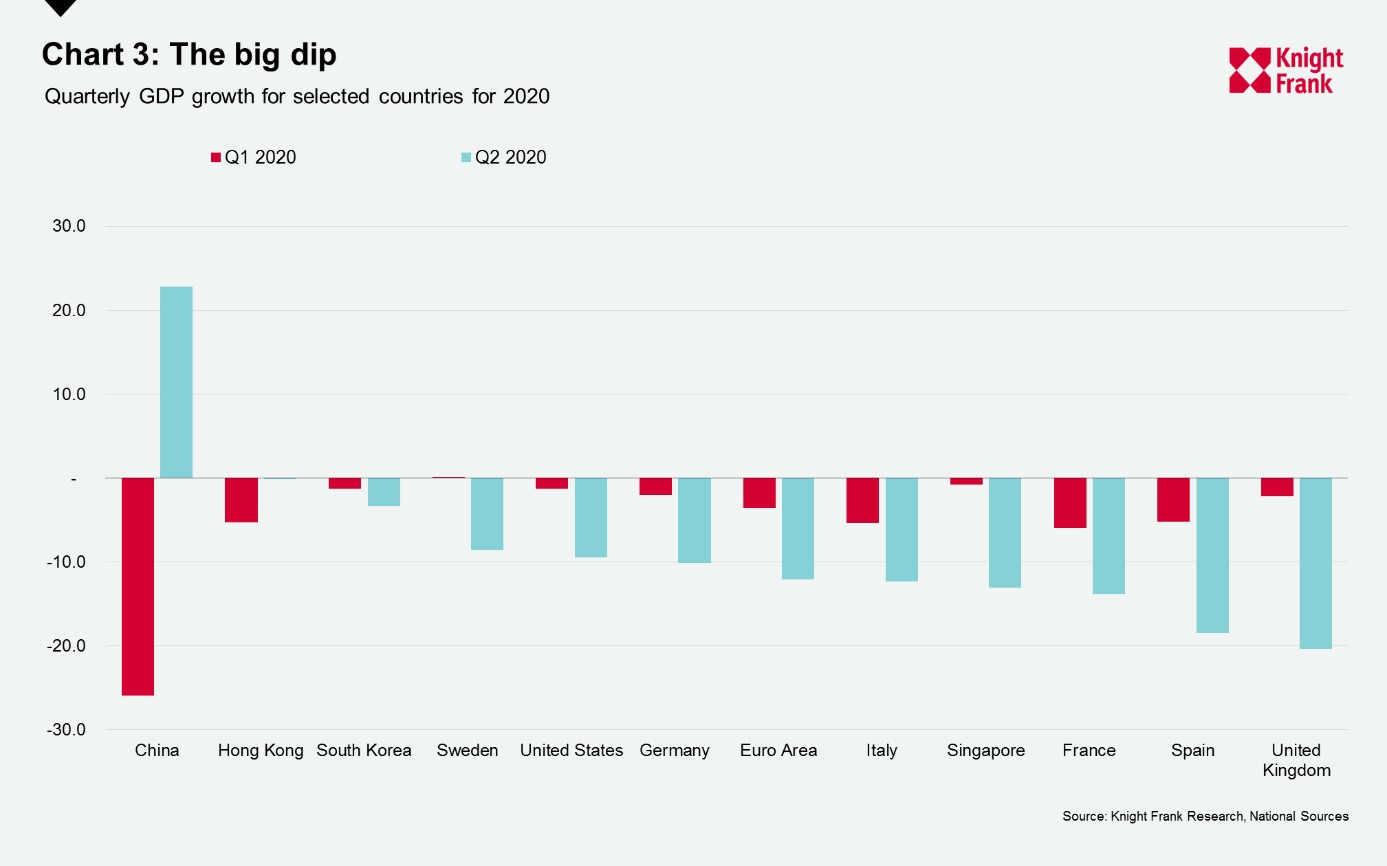
Some economies have published their second quarter GDP results which capture the impact of widespread lockdowns, the biggest impact of which was felt in April. The chart shows Q1 and Q2 GDP quarterly growth figures. Much of this was to be expected. The UK was among the hardest hit, with a quarterly decline of 20.4% in Q2, followed by Spain with a fall of 18.5%. China is the only economy shown which experienced growth in the second quarter as the impact of Covid-19 was most acutely felt in the first quarter of this year.
The UK is one of the only economies to publish monthly data which showed the pace of recovery in the second quarter, with growth of 1.8% in May and 8.7% in June when restrictions on retail were lifted, July should provide an even bigger boost as restaurants began opening to diners from 4 July.
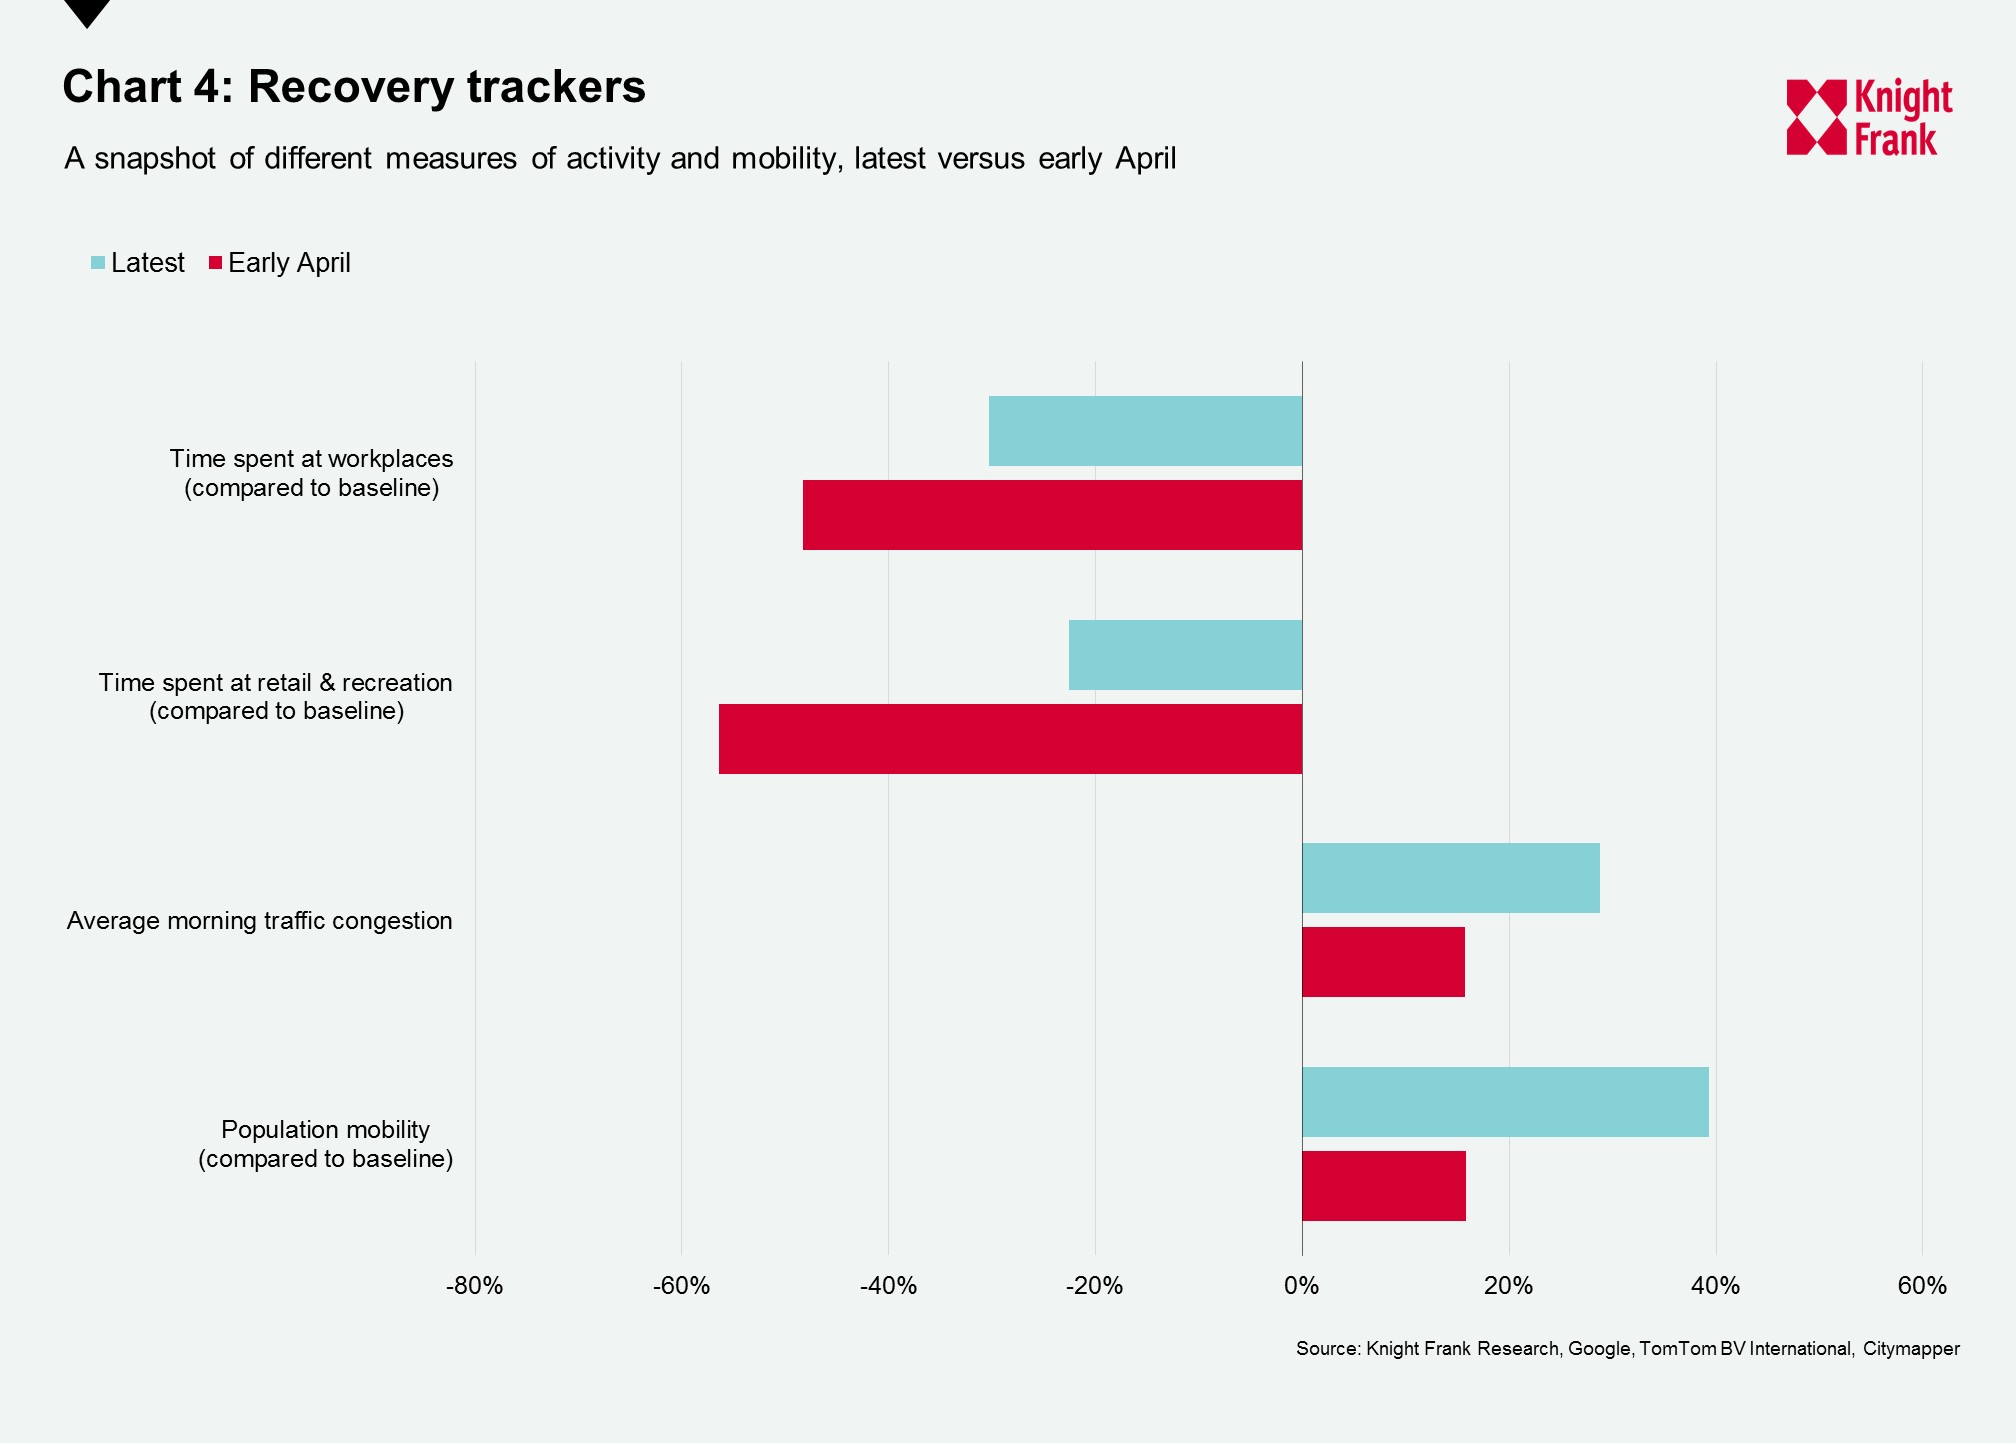
We have been tracking various mobility measures across global cities since the onset of the pandemic to measure the dip in activity and the subsequent recovery. Across all measures there has been a vast improvement since the trough of activity in late March and early April.
In early April, Google’s mobility report suggested that, globally, time spent at places of retail or recreation was down by 56% compared to a baseline average. The latest figures suggest this is now only 23% below the average. Tokyo has seen on average 3% more time spent at these locations. Whilst many still work from home some are returning to offices. The time spent at workplaces has gone from, on average 48% below baseline in early April to 30% below now.
Citymapper’s population mobility tracker has seen a rapid increase, with cities going, on average, from less than 20% mobility to almost 40%, where 100% would represent full mobility. The most mobile locations include Singapore, Vienna and Berlin where on average population mobility was 72%, 69% and 61%, respectively, of the normal level over the past seven days.
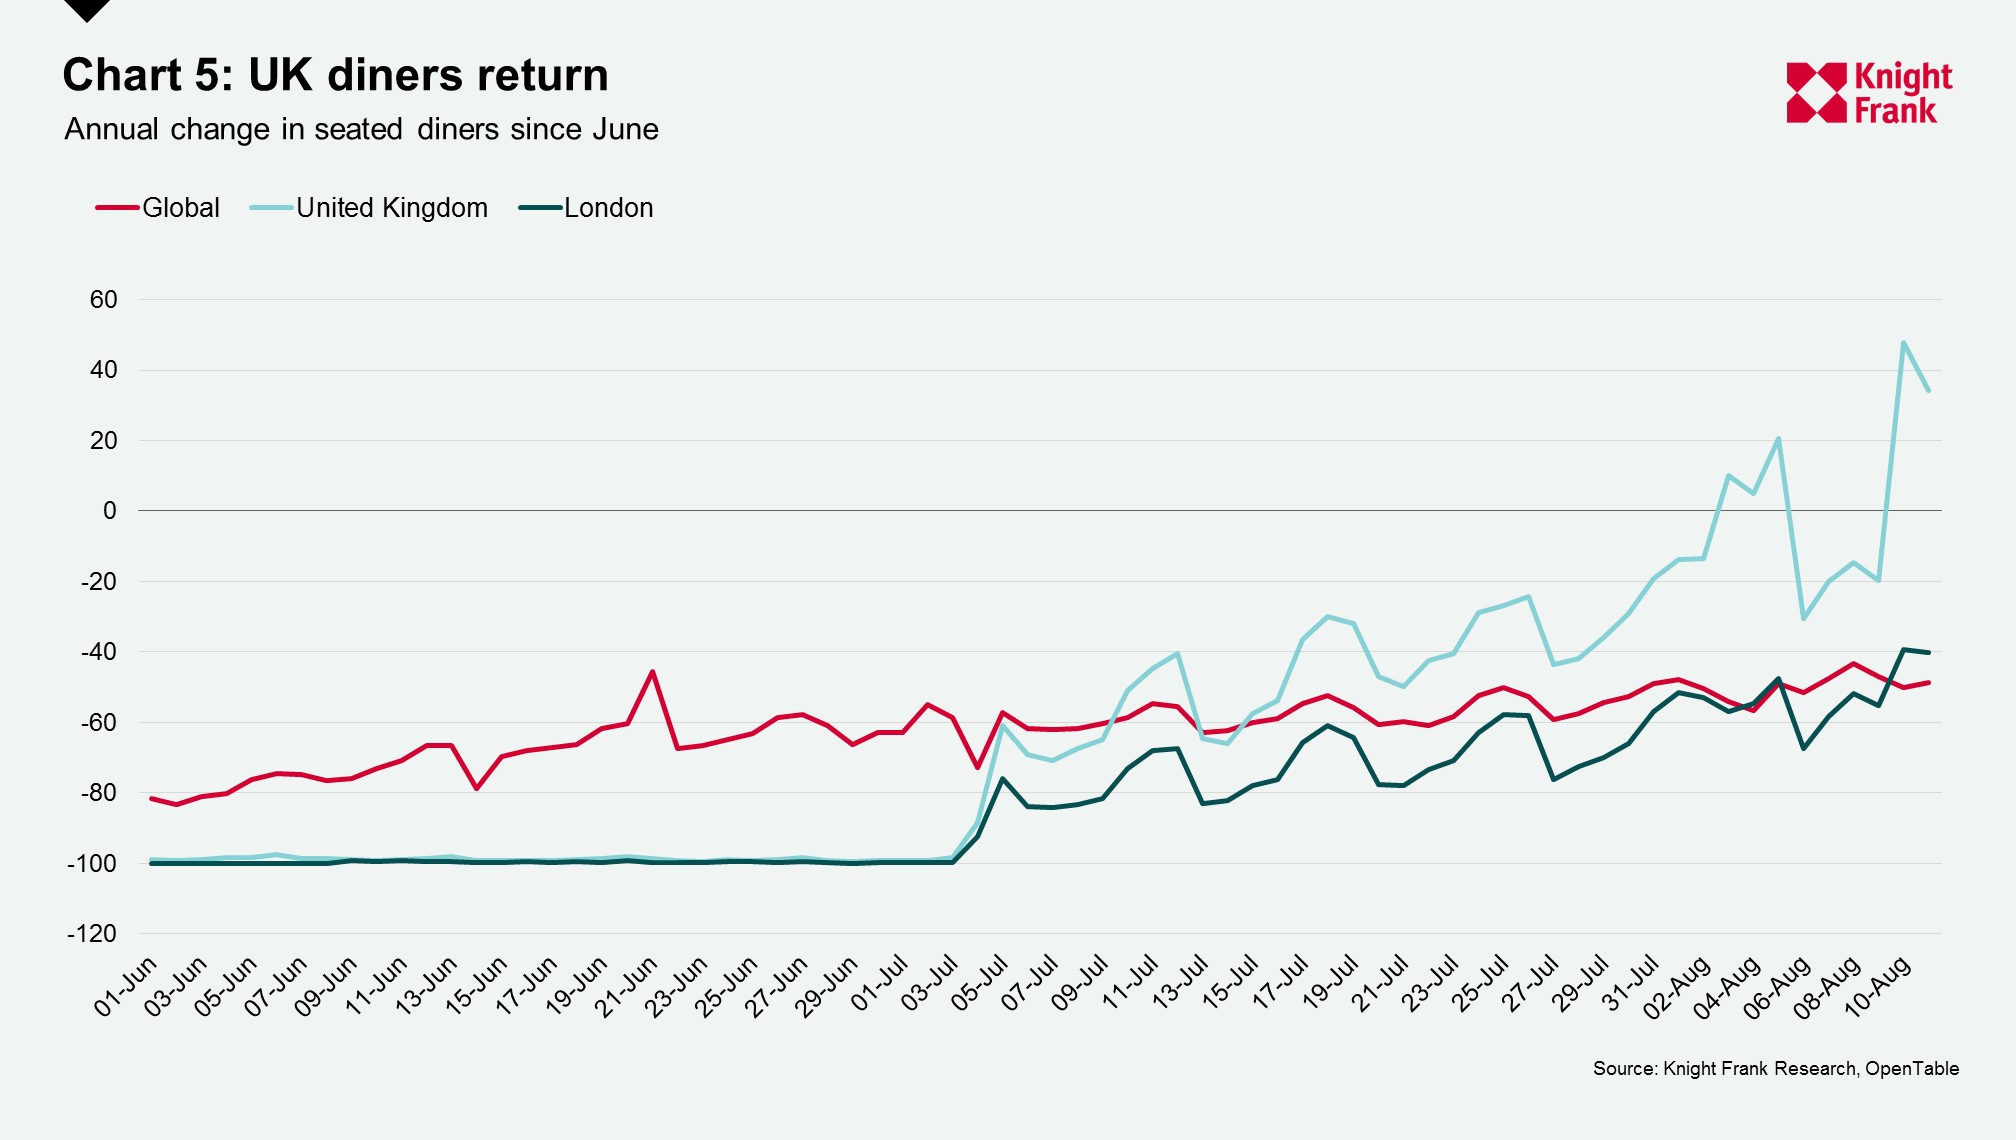
The chart shows the change in seated diners at restaurants compared to the same day last year. Restaurants in the UK were open to diners from 4 July and since then there has been a steady increase in the level of people eating meals out.
The introduction of the UK Governments ‘Eat out to Help Out’ scheme on 3 August has seen positive annual change across the UK for the Monday-Wednesday period when the scheme operates. In the first week the number of diners was 12% above last year and for Monday and Tuesday this week the average was 42% above last year.
However, on the days when the scheme is not in operation the level of diners is on average 21% below last year showing consumers are willing to go out and spend but only where they perceive a good deal.