Global City Economic Watch
As large-scale quarantine measures limit the movement of urban populations globally, we are providing a weekly glance at real-time indicators to assess the level of slowdown in economic activity and how quickly cities are beginning to return to normal.
2 minutes to read
In this week’s edition we look at different indicators within Google’s COVID-19 Community Mobility Report* on a city-by-city basis and provide an update on the latest flight activity.
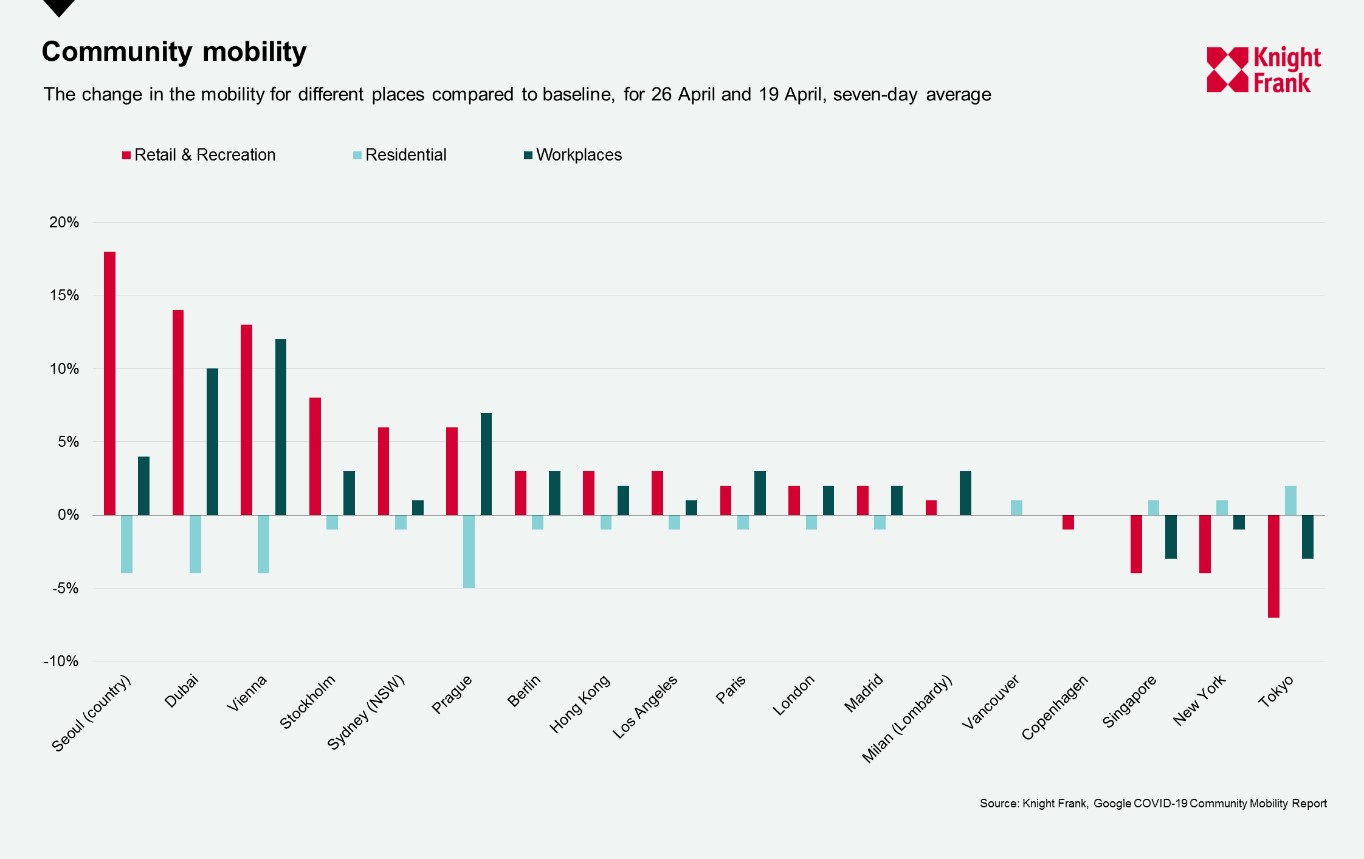
Google’s COVID-19 Community Mobility Report analyses how visits and the time spent at different places have changed compared to a baseline. Here we look at how the mobility for retail & recreation, residential and places of work have changed in the week ending 26 April compared to a week earlier.
12 of the 17 locations we looked at saw an increase in visits and time spent at retail & recreation places. This is most notable in cities which have begun lifting restrictions such as Dubai, Vienna and Prague who’s metrics moved to 62%, 71% and 64% less than baseline respectively – so they still have some way to go. Seoul is closest to their baseline for these areas with only 6% less mobility.
Many of these cities saw more people spending less time at residential spots and more at places of work. Whilst Vienna saw mobility for workplaces increase it still sits 33% below the baseline. Without full lockdown measures in place is it unsurprising that Seoul and Stockholm are closest to their respective baselines with 12% and 17% less time spent at workplaces.
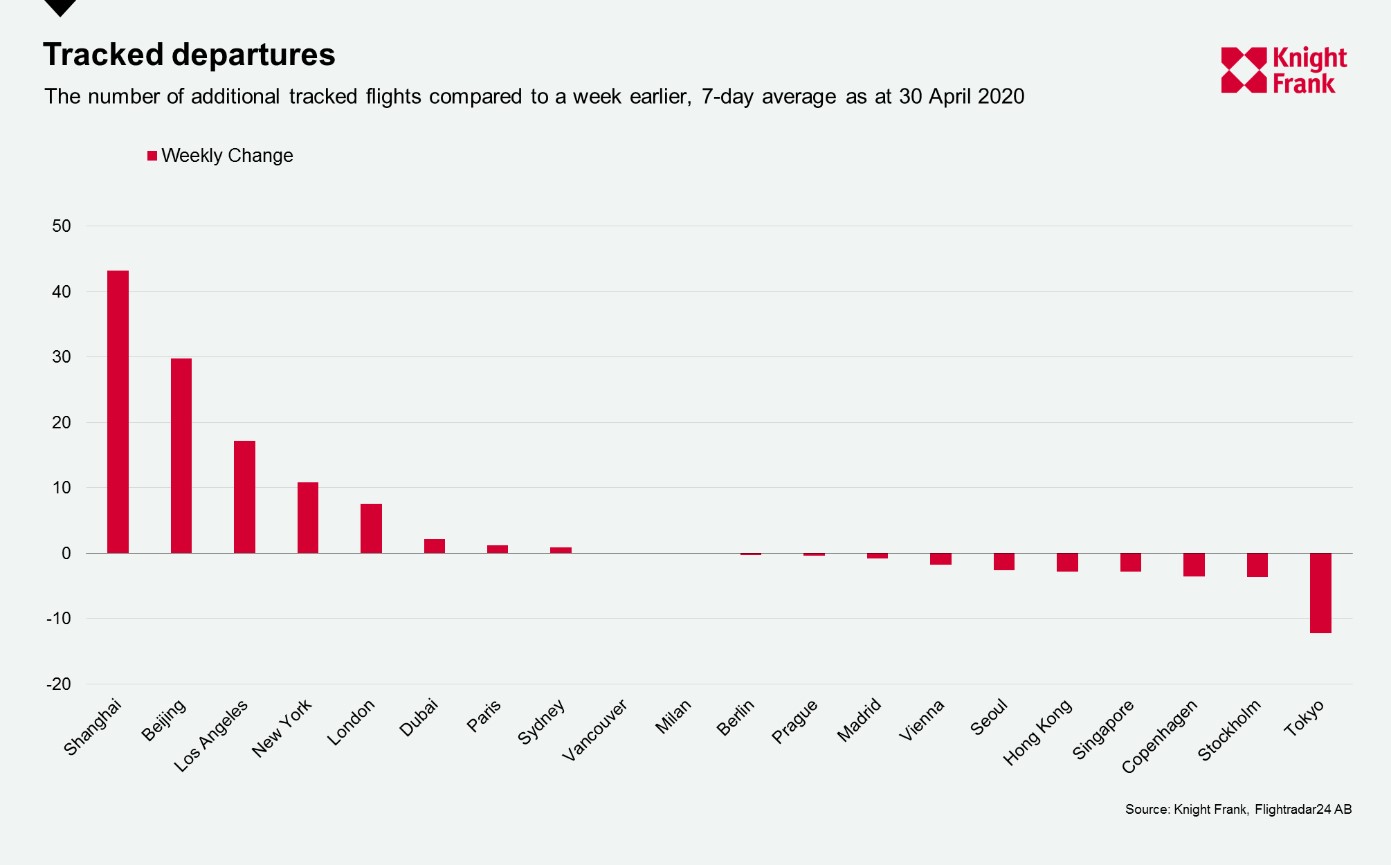
With travel restrictions in place across many countries, the number of scheduled and tracked flight departures has drastically fallen in recent weeks. However, there has recently been some carriers pledging to restart activity, most recently Wizz Air looking to restart routes from London’s Luton.
As with the Google mobility measures there has been an uptick in the average number of tracked flight departures from eight out of the 20 cities we look at. The largest increase came, unsurprisingly, in the two Chinese cities as they return to normality. Los Angeles and New York saw the third and fourth largest growth, although this only equated to, on average, an additional 17 and 11 flights, and both remain around 45% lower than the flights departing a month ago.
Next week we will check in on the latest for the Citymapper Mobility Index and TomTom Traffic Index to see how the population are moving around each city. We will also be keeping an eye on other high frequency indicators such as restaurant bookings and box office takings for when these establishments start to reopen.
Notes on methodology
*Google’s COVID-19 Community Mobility Report analyses the how visits and time spent at different places change compared to a baseline. The baseline is the median value, for the corresponding day of the week, during the 5- week period Jan 3–Feb 6, 2020