Global mobility in five charts
Real-time data has provided a timely insight into the level of disruption faced in global cities and the speed of return to normality. Here, we look at five different indicators to evaluate the speed of return to travel, offices and general mobility around global cities.
4 minutes to read
Many of the indicators show that in early-April there was an average decline in activity of around 50% from baseline. The easing of lockdowns and return to a new normal has seen the gap close to around 20%.

Commercial air travel almost came to a total halt from early-March to mid-April, falling 73% as borders closed and lockdowns were implemented across countries and regions. Since the trough in April the number of flights has more than doubled, but still remains about a third off the mid-March level.
The level of travel restrictions will hamper global mobility and distort capital flows for some time to come, and the ongoing resurgence in cases and regional lockdowns will play a part. For example, when stricter measures were put in place in Beijing in June the number of flight departures dropped from just under 400 a day to around 100 – they have since recovered and on average are around 450 a day.
Across the 20 cities we monitor there is still on average 120 less flights a day, yet this compares to almost 250 less at the height of the crisis. Whilst this is a step in the right direction, there is a long way to go. This will weigh more heavily on those tourism reliant property markets.

The pandemic started a massive global workplace experiment. In early-April across our 18 locations, activity at workplace was 50% below normal. At the end of August this had receded to 28% below baseline. As more return to the office this will have a multiplier effect on the economy as spending on travel, food and other amenities will increase.
Those cities where strict national lockdowns were avoided, such as Seoul, Hong Kong and Stockholm, saw the lowest dips in workplace activity. Their early-April levels were 7%, 21% and 36% below baseline respectively.
Even though these economies have fared better than some in relation to GDP, their recovery has been fairly flat – the activity at workplaces in Hong Kong for example still remains 22% below baseline. Whether this indicates the ‘new normal’ level whilst the pandemic is ongoing remains to be seen.
Seoul sits at the top, just 11% below baseline, followed by Sydney at 15% below and Copenhagen at 19% below. European citizens appear most cautious with London, Paris, Madrid and Milan seeing fewer workers returning with levels between 36% and 45% below baseline. With cases surging in some areas this may limit the uptake and lengthen the time to recover.
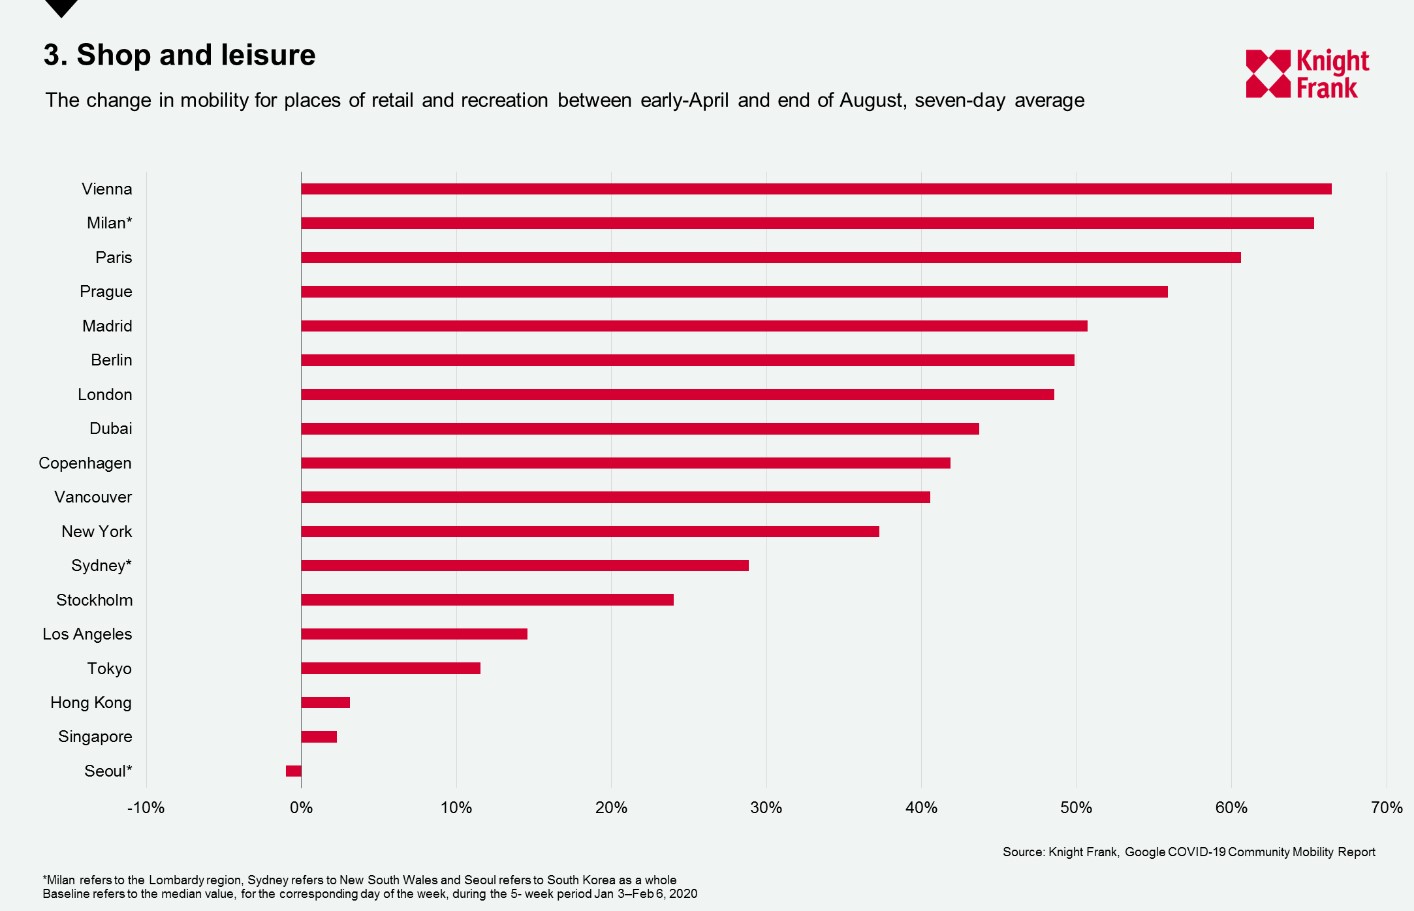
Time spent at retail and recreation locations fell further than activity at work places - on average by 56% in early-April. However, the return to these places has been quicker with activity, on average, only a fifth lower than baseline at the end of August.
European countries have seen the largest rise in time spent at retail and leisure places, yet these locations also saw the biggest drop during the pandemic. Vienna and Milan have seen their respective levels of activity go from 80% and 90% below baseline to 13% and 25% below.
Seoul is the only location to see mobility drop. With South Korea avoiding a full national lockdown yet taking a more regionalised approach with rigorous test and trace they have maintained a relatively high level of mobility throughout. On this measure the activity is only 18% below baseline, from 17% below in early-April.
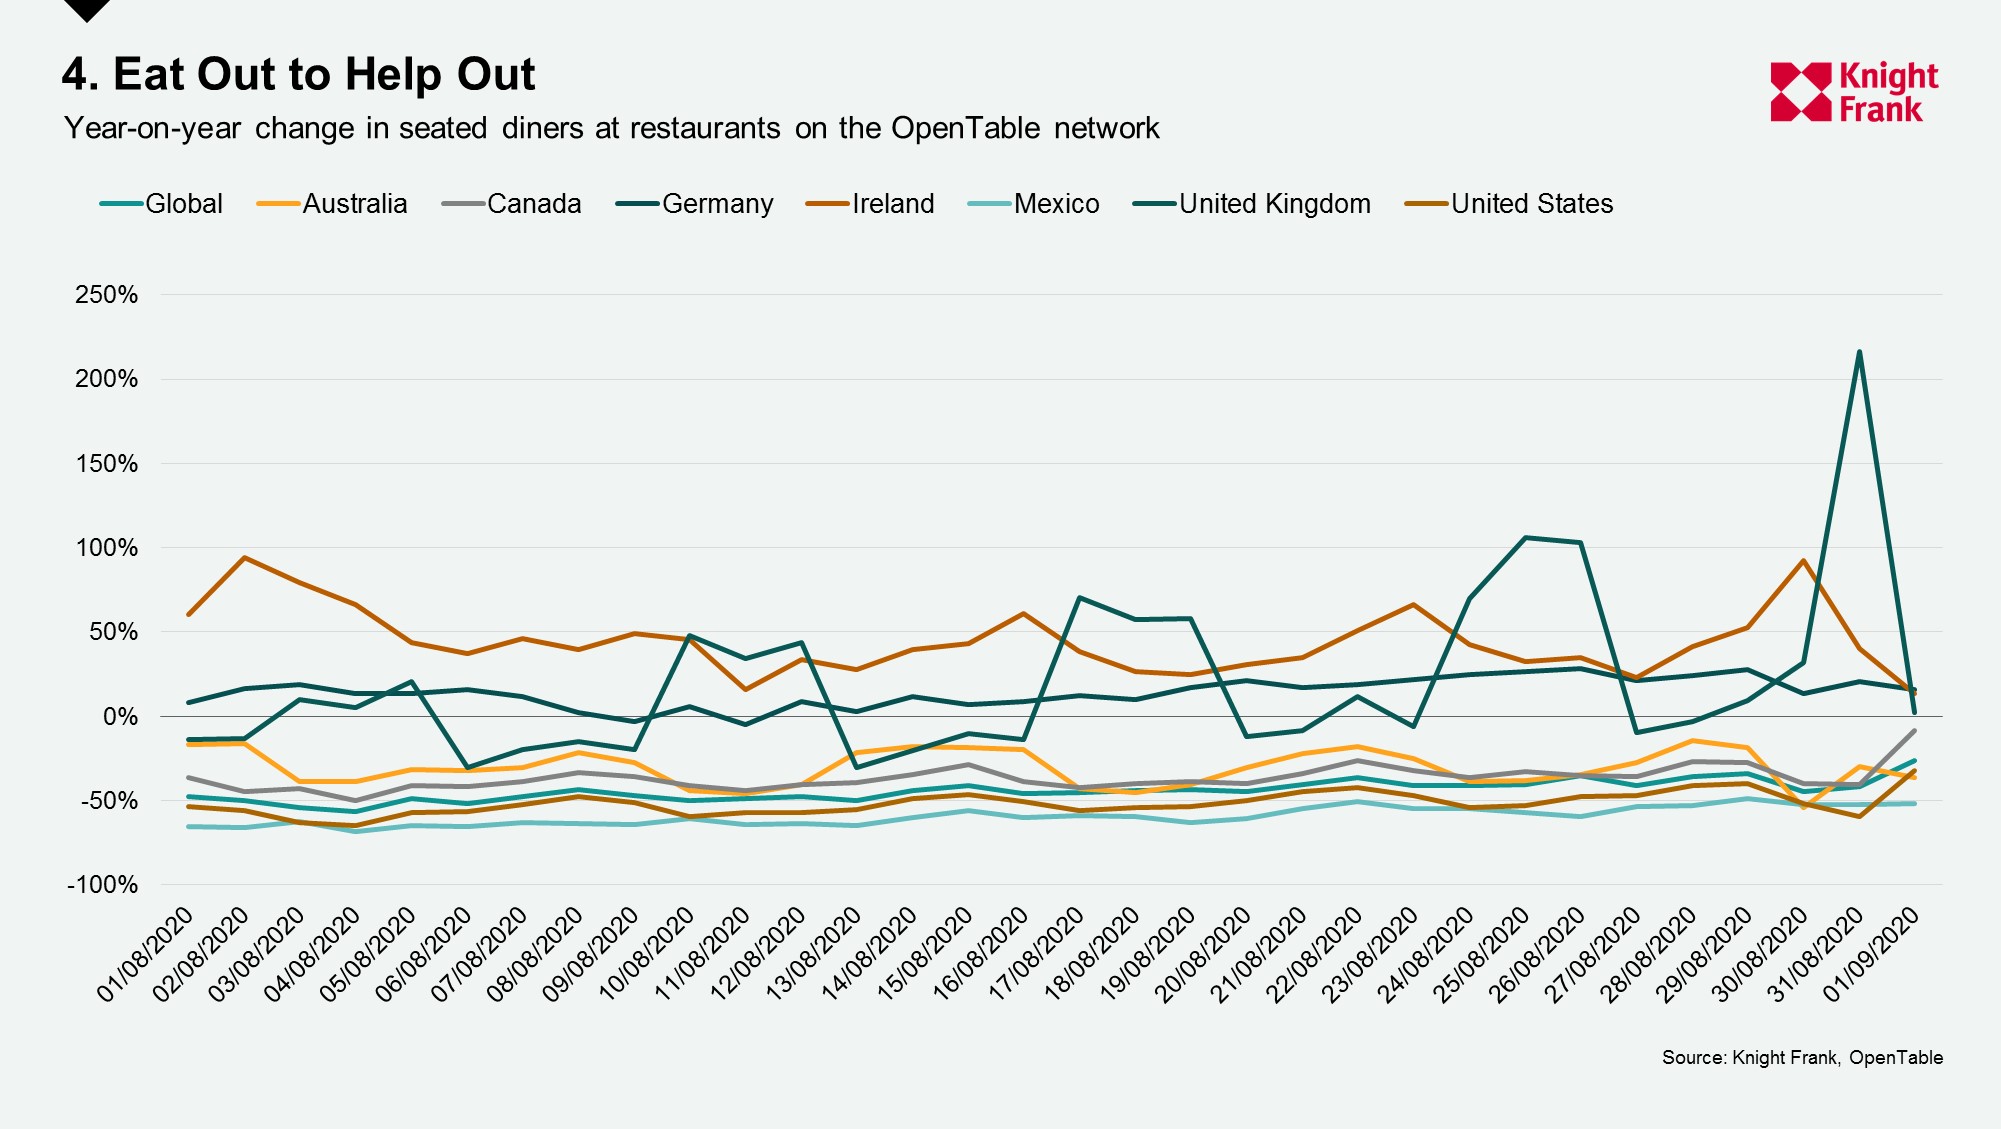
Restaurants have seen a larger bounce back than other sectors. Ireland, the UK and Germany saw restaurant bookings, on average, 46%, 22% and 14% above last year in August.
For the UK this demonstrates the success of the Eat Out to Help Out scheme. There were spikes in demand for Monday-Wednesday, when the scheme was in operation, with bookings 50%, on average, higher than last year. As confidence in dining out has built the levels of bookings on subsequent days also equalled or rose above 2019 levels.

With the gradual resumption of normal activities, many have returned to the roads. In Beijing and Copenhagen the level of congestion is above 2019 levels indicating more are travelling by car.
Berlin, Shanghai and Stockholm all sit within 3% of their 2019 levels, whilst Milan, Madrid and Los Angeles are around 50% off. Whilst some remain off the roads it is clear from the other indicators that people are resuming some level of activity – it may be the case that due to health concerns many are opting for cycling instead.
Madrid is the exception. The recent rise in cases across Spain has led to morning traffic congestion being lower last week that it was in early-April, yet the workplace activity has not significantly dropped to match. This could be evidence that working patterns are changing, with many avoiding the traditional rush hour times, or potentially that those who can reach their place of work via other means are first to resume.
Main photo by Sunyu Kim on Unsplash