Global City Economic Watch Tuesday 16th June
As large-scale quarantine measures begin to be lifted globally, we are providing a weekly glance at different real-time indicators to assess the level of economic activity in cities and understand how much closer to ‘normality’ they are.
3 minutes to read
In this week’s edition we look at different indicators within Google’s COVID-19 Community Mobility Report* on a city-by-city basis and provide an update on the latest flight activity.
Google’s COVID-19 Community Mobility Report analyses how visits and the time spent at different places have changed compared to a baseline. Last week my colleague looked at the country level in Asia-Pacific to see who is emerging quickest, by seeing mobility at places of retail & recreation, work and transit, below we do this for 18 cities looking at the latest data, compared with two months ago when most were in full lockdown.
European cities lead for the biggest improvements with Paris, Prague, Vienna, Milan and Madrid representing the top five, but lockdowns here were some of the strictest. When we look at absolute numbers some of these, with the exception of Prague, are still some of the cities with the lowest mobility when compared to baseline, see Table 2.
As in previous weeks Seoul and Hong Kong are the cities closest to their respective baselines, but they are now joined by Prague, Stockholm and Sydney which continues to see a relaxation of restrictions. Across the three measures tracked, these five cities sit less than 25% below baseline with Seoul only 4% below on average. London sits the furthest away, on average 64% below baseline, but with non-essential retail reopening yesterday this looks likely to change in the coming weeks.
Table 1: The difference in mobility, for selected places, from 7 April to 7 June, seven-day moving average
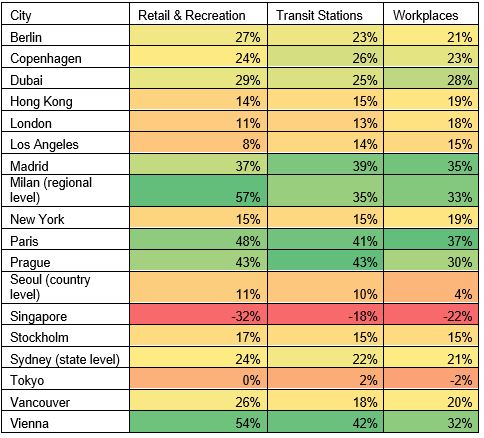
Table 2: The current level of change in mobility from baseline as at 7 June, seven-day moving average

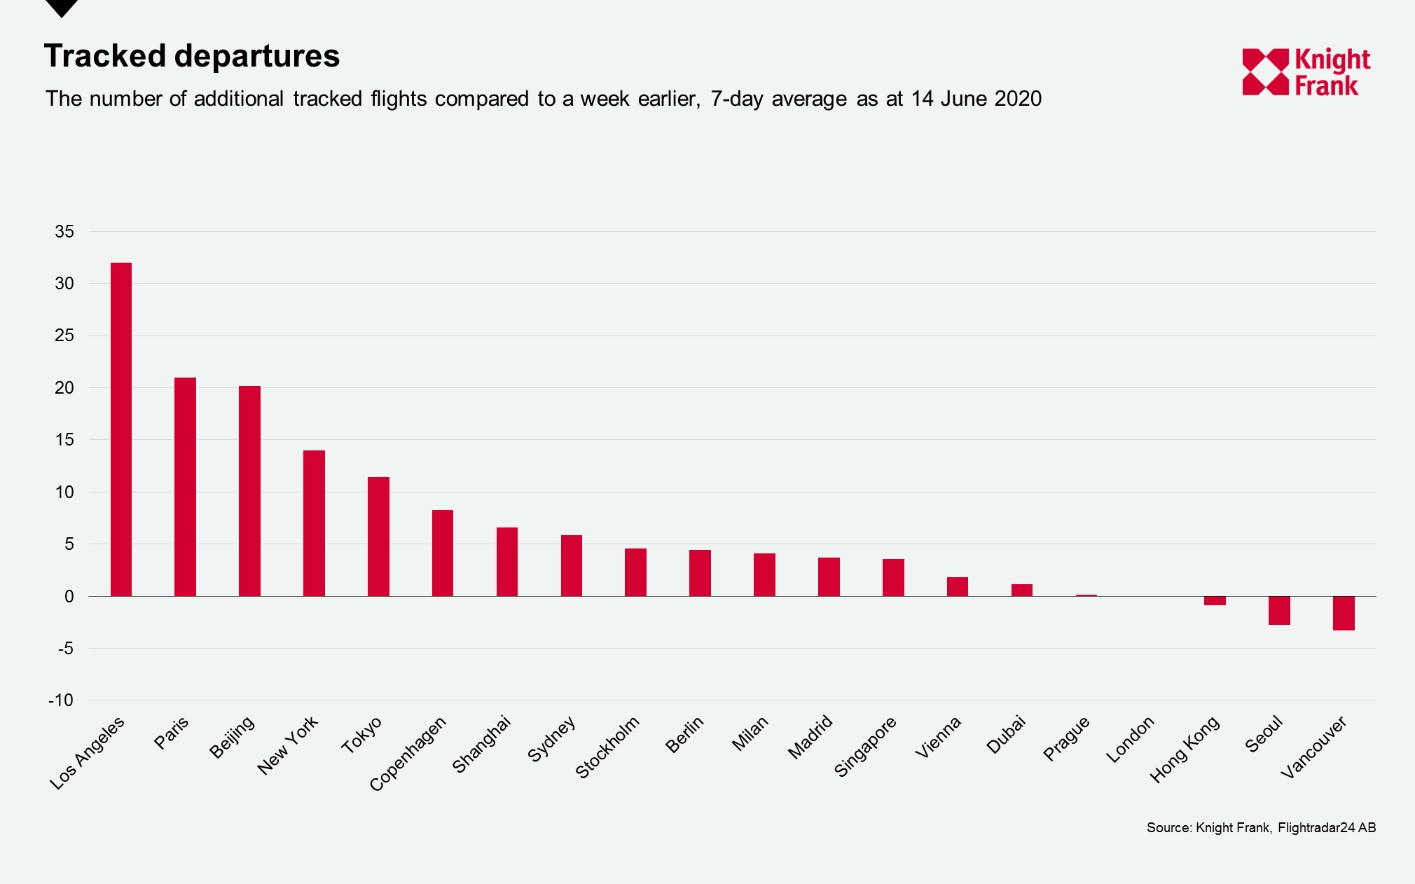
The recovery of commercial airlines is going to be key over the next few weeks and months in assessing if there is a pick-up in tourism-related activities as more countries reopen borders, starting with many in Europe this week.
In five of the 20 locations there was a double-digit rise in the average number of flights over the past seven days when compared to a week earlier. Los Angeles, Paris, Beijing, New York and Tokyo saw their average departures rise by 32, 21, 20, 14 and 11 respectively. However, most still remain 70%-90% below the level they were operating at three months ago.
In absolute terms, Beijing, Shanghai and Los Angeles are seeing the highest level of departures with 368, 327 and 278 on average over the most recent seven days. Prague, Berlin and Vienna have seen the lowest with 8, 15 and 16 respectively - as Europe opens this may rise in the coming weeks.
Next week we revisit population mobility through the Citymapper Mobility Index and TomTom Traffic Index as well as the level of restaurant bookings as economies begin to emerge from lockdown and restaurants offer limited seated capacity.
Notes on methodology
*Google’s COVID-19 Community Mobility Report analyses the how visits and time spent at different places change compared to a baseline. The baseline is the median value, for the corresponding day of the week, during the 5- week period Jan 3–Feb 6, 2020