Global House Price Index
The Global House Price Index tracks the movement in mainstream residential prices across more than 50 countries and territories worldwide using official statistics
2 minutes to read
The data in this report is backward looking and covers the period up to 31 March 2020 when Covid-19 was at its peak in parts of Asia but had yet to take its toll on large parts of Europe, North and South America.
As we’ve outlined in our regular daily research updates we expect the pandemic to hit sales volumes harder than prices but it is likely to be Q2 or Q3 before the true impact on prices is known.
That said, it is unlikely that sellers will lower asking prices significantly given low interest rates and the introduction of mortgage holidays across most advanced economies which will help prevent widespread distressed selling.
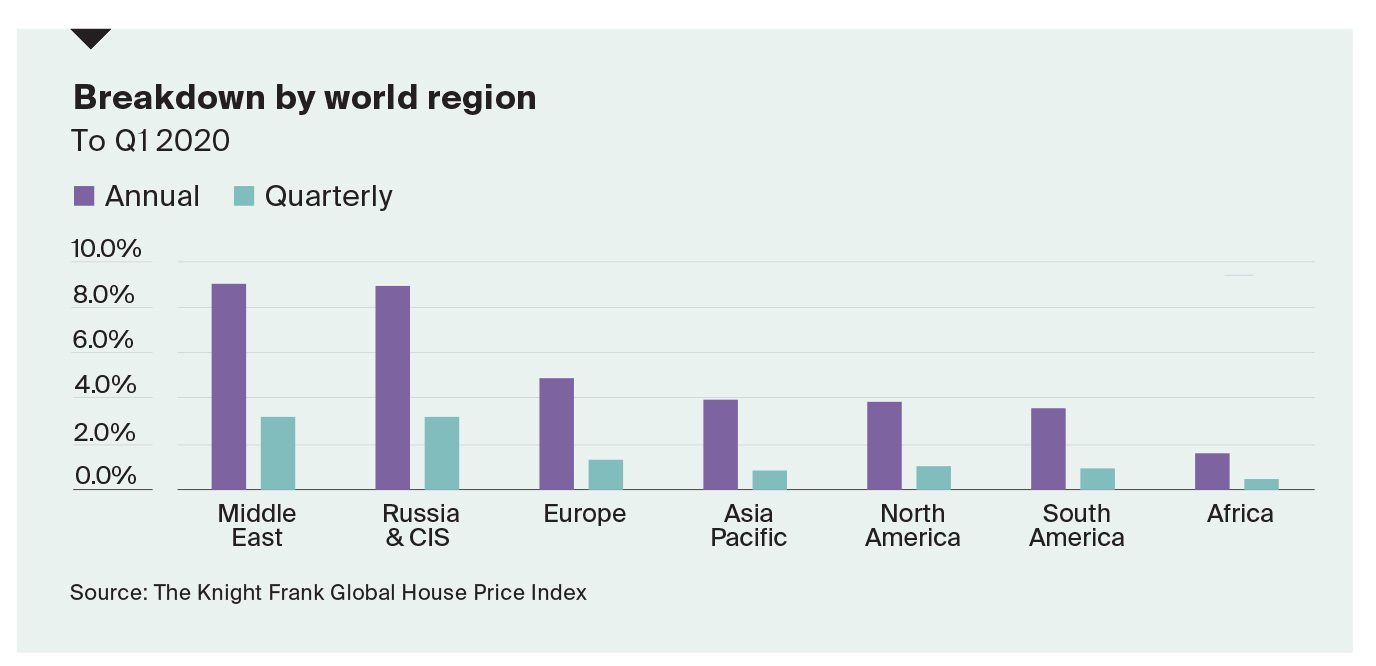
Surprisingly, of the 56 countries and territories tracked, only one saw prices decline year-on-year – Finland, and only by 1.2%. Since we first started the index in 2008, this represents the highest proportion (98%) of countries registering positive price growth on an annual basis.
The story over a three-month period however is different. Thirteen countries and territories registered price declines in Q1 2020. Of the 13 to see declines, nine were European markets.
Turkey leads the annualised rankings with price growth of 15% but in real terms, when adjusted for inflation, prices increased by only 6%.
New Zealand, a country which a year ago was ranked 27th in our rankings, has accelerated to second place with annual price growth of 14.5%, only marginally lower than the frontrunner Turkey.
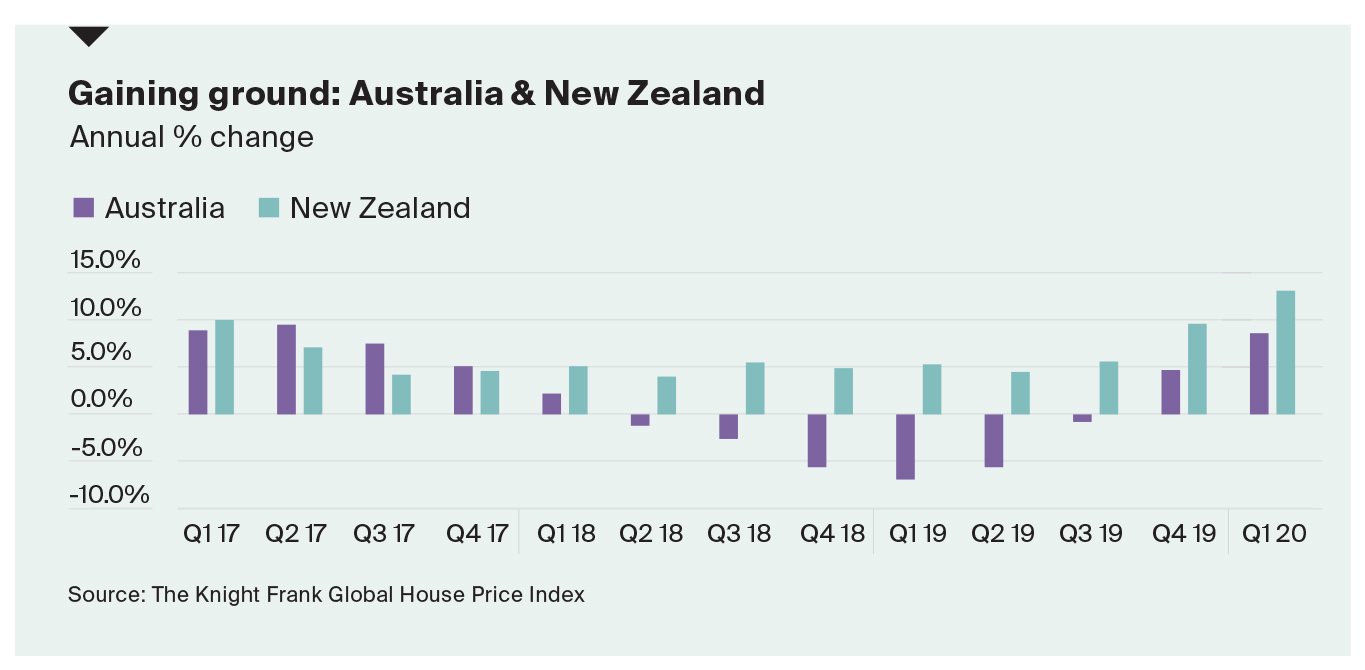
Low interest rates and strengthening demand pushed prices higher in March but data released for April shows sales volumes across New Zealand slipped 79% monthon- month, from 6,082 to 1,305 sales although prices held steady.
China, where Covid-19 case numbers peaked in February, saw its rate of annual price growth moderate from 6.8% in Q4 2019 to 5.4% in Q1 2020. In contrast, Australia registered a punchy 8.6% annual growth, up from 5.3% in Q4 2019.
The UK saw its annual rate of growth moderate slightly between Q4 2019 and Q1 2020, whilst the US and Canada saw annual price growth accelerate, albeit marginally. However, as Teranet and the Bank of Canada reported it is likely this will be the swan song before the impact of Covid-19 is felt in our Q2 results.
Read the report in full here
For any queries please contact Kate Everett-Allen