Global City Economic Watch
As large-scale quarantine measures limit the movement of urban populations globally, we are providing a weekly glance at real-time indicators to assess the level of slowdown in economic activity and how quickly cities are beginning to return to normal.
3 minutes to read
In this week’s edition we look at what has happened over the past two weeks in terms of each city’s traffic congestion and population mobility. We have also added in Stockholm as Sweden’s approach has garnered much attention as they have avoided full lockdown but encouraged social distancing- how has this impacted mobility?
The Citymapper Mobility Index* which looks at the proportion of the population moving compared to usual shows an uptick in movement in many of our cities, particularly those relaxing lockdown measures. In both Berlin, where some shops opened last week, and Copenhagen the proportion of population moving around, on a seven-day average, increased by three percentage points in the past week to 15% and 14% respectively. Vienna also saw their mobility rise by two percentage points as measures were relaxed.
Despite not being in full lockdown the Swedish government has encouraged social distancing. Stockholm has seen 30% of the population moving around compared to usual, which is up from 28% a week ago – of the cities we track it is the third most mobile city behind Hong Kong and Seoul.

In terms of traffic congestion as measured by TomTom**, Berlin and Copenhagen both moved four percentage points closer to their 2019 level of traffic congestion to an average of 27% and 17% respectively, compared to their 2019 averages, both of 47%.
The latest data from China, shows a semblance of normality has returned , Beijing continued to see traffic congestion above its 2019 level, increasing by six percentage points in the last week, Shanghai sits just five points lower than its 2019 average of 58%.
There were small upticks, by one or two points, in many European and North America cities including Paris, New York and London, whilst Prague, which is still 25 points below its 2019 average, saw an uptick of 3% after some measures were relaxed. At 29% congestion levels in Stockholm, are moving closer to their 2019 average of 52%.

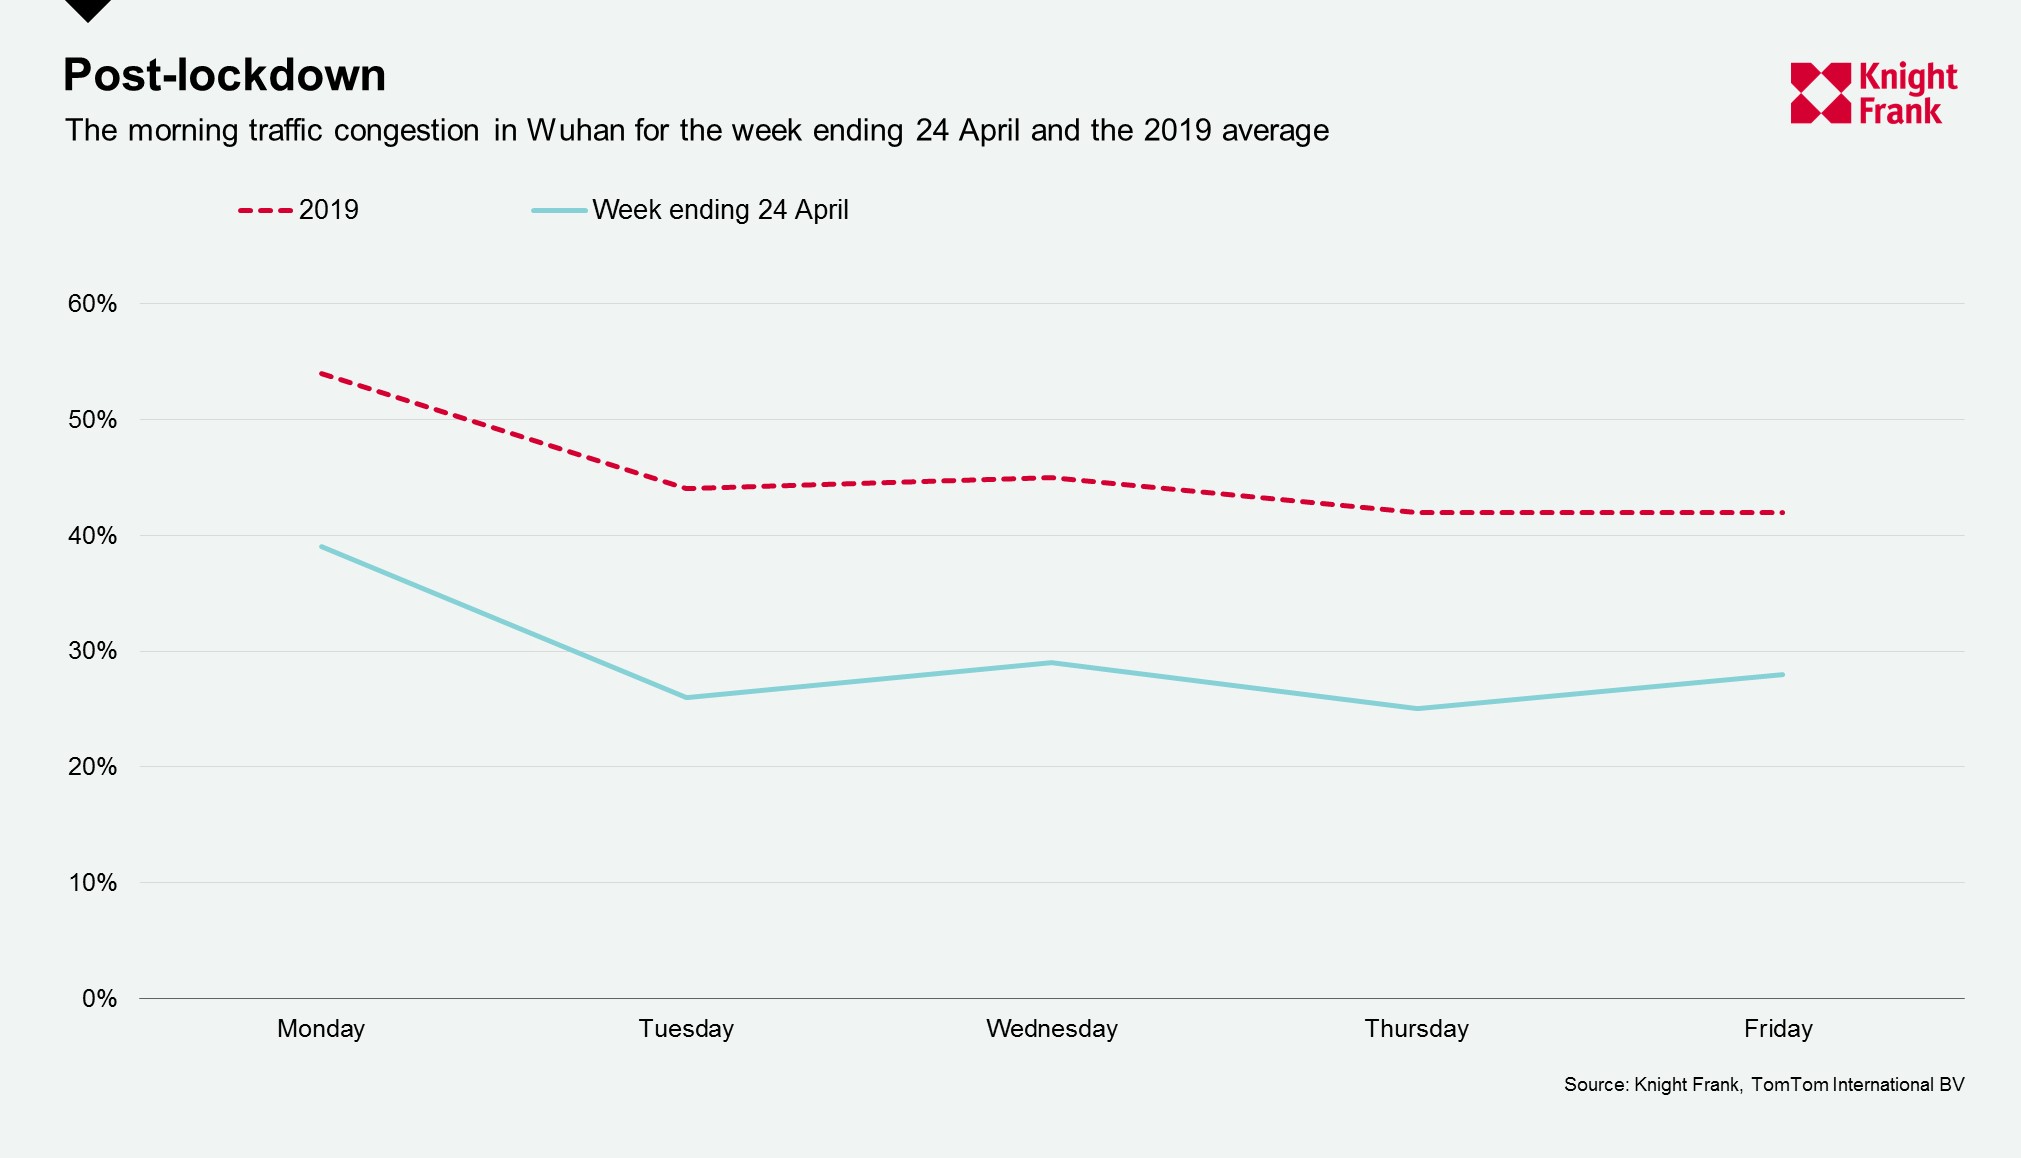
Below we also take a look at the city of Wuhan, the epicentre of the pandemic. Here, two full weeks after the lockdown was lifted traffic congestion is still some way below 2019 levels. As activity resumes there has been an uptick, with a weekly average of 29% compared to 24% a week earlier, but on average congestion remains 16 percentage points lower than its 2019 level.

Next week we will check in on different indicators from the Google’s COVID-19 Community Mobility Report and the level of flight activity from FlightRadar24. We will also be keeping an eye on other high frequency indicators such as restaurant bookings and box office takings for when these establishments start to reopen.
Notes on methodology
*The Citymapper Mobility Index looks at the percentage of the population moving compared to a recent typical usage period, they do this by comparing trips planned in the Citymapper app to a recent typical usage period as trips planned are correlated to trips taken.
**The congestion level looks at how much longer a trip would take compared to baseline, e.g. a level of 53% means that a 30-minute trip will take 53% more time than it would during baseline uncongested conditions.